

Translate this page into:
Do elastography values correlate with molecular subtype of breast cancer or is morphology the key player?
 , Prema Subramaniam1, Vinita Thakur2, Divya Vishwanatha Kini1, P. Suganya1, Adrija Mandal1
*Corresponding author: Rupa Renganathan, Lead Consultant, Division of Breast and Women’s Imaging and Interventions, Department of Diagnostic and Interventional Radiology, Kovai Medical Center and Hospital, Coimbatore, Tamil Nadu, India. drrupa@kmchhospitals.com
-
Received: ,
Accepted: ,
How to cite this article: Renganathan R, Subramaniam P, Thakur V, Kini DV, Suganya P, Mandal A. Do elastography values correlate with molecular subtype of breast cancer or is morphology the key player? Indian J Breast Imaging. 2024;2:21-8. doi: 10.25259/IJBI_8_2024
Abstract
Objectives
We evaluated the association between shear wave elastography (SWE) parameters and the molecular subtypes and other prognostic factors of breast cancer. We also examined the influence of morphological characteristics and other prognostic factors of breast cancers on elastography values.
Materials and Methods
This is a retrospective observational study on 148 patients with biopsy-proven 152 breast cancers who underwent both B-mode ultrasonography and SWE. The analysis involved calculating the correlation between the five quantitative parameters on SWE (mean, minimum, maximum, standard deviation, and ratio) and the molecular subtyping and other prognostic factors of breast cancer. We analyzed the influence of morphology and other prognostic factors on SWE parameters.
Results
The mean, minimum, and maximum values in SWE were significantly lower (P<0.05) in cases where the lesion displayed non-mass abnormality, circumscribed margins, posterior acoustic enhancement, and non-ductal histopathology. Hormone positive tumors frequently exhibited spiculated margins and higher (P < 0.05) elastography values, although within this category, circumscribed masses demonstrated lower elastography values compared to the remaining cases. Triple negative breast cancers often displayed circumscribed margins and lower (P < 0.05) elastography values; however, among this subgroup, masses with spiculated margins exhibited higher values compared to the rest.
Conclusion
Our findings indicate that elastography independently do not correlate with molecular subtypes in breast cancer. Morphological features and histopathological subtypes appear to have strong influence on elastography values.
Keywords
Shear wave elastography
Morphology
Molecular subtyping

INTRODUCTION
Breast cancer exhibits heterogeneity in clinical, imaging, and prognostic factors.[1] Through gene expression profiling, the understanding of breast cancer heterogeneity has been significantly advanced, and classified into four molecular subtypes, namely Luminal A, Luminal B, HER2 enriched, and Basal-like Triple Negative Breast Cancers (TNBC). These subtypes differ significantly in terms of incidence, clinical and imaging characteristics, treatment response, disease progression, and survival rates.[2] The determination of molecular subtypes is based on percutaneous biopsy samples and relies on the presence or absence of estrogen receptor (ER), progesterone receptor (PR), HER2 receptor, and Ki-67 levels.[3] Molecular subtyping not only enhances our understanding of breast cancer characteristics but also plays a crucial role in the treatment decision-making and the development of targeted therapies. Luminal A cancers demonstrate the most favorable prognosis among all subgroups, whereas basal-like TNBC represent the most aggressive subtype with a high likelihood of metastasis and recurrence.
There have been numerous studies conducted on the prediction of molecular subtypes of breast cancer using various imaging modalities and techniques. Previous research has firmly established that tumors that are positive for ERs typically exhibit spiculated margins and posterior shadowing.[4–7] Conversely, TNBC often display circumscribed margins accompanied by posterior acoustic enhancement.[4–9] Additionally, HER2 positive cancers tend to present with microcalcifications and multifocal involvement.[5,6,8]
Over the past decade, ultrasound elastography has emerged as a significant addition to the repertoire of sonographic techniques due to its ability to assess tissue stiffness in vivo. The literature contains a limited number of studies that assess the utility of SWE in predicting the molecular subtypes of breast cancer. The findings of these studies exhibit considerable variation.[10–17] Some studies demonstrate no correlation between elastography values and molecular subtypes of breast cancer,[10,12,14,15] while others indicate an association between molecular subtypes and elasticity values, albeit with conflicting outcomes.[11,13,16,17]
This study aims to analyze if elastography values correlate with molecular subtypes of breast cancer and to observe further the influence of morphology and other prognostic factors on SWE parameters in different molecular subtypes of breast cancer.
MATERIALS AND METHODS
Study design
This is a retrospective observational study that has been approved by the institutional ethical committee (EC/AP/732/07/2019) and informed consent was waived. All consecutive patients with biopsy-proven breast cancer from July 2019 to June 2020, who underwent both grayscale and SWE before the biopsy, were included in the study. As an institutional protocol, in our institute, SWE is performed for all the solid breast masses. Search from our hospital Picture Archiving and Communication System (PACS) database revealed that 194 patients with 198 breast cancers had undergone both grayscale and SWE. From this cohort, 46 lesions were excluded because of technical limitations in elastography images or measurements (5/46), mass >5 cm in size (22/46), or unavailability of pathology/immunohistochemistry (IHC) data (19/46) as shown in Figure 1. The final study population consisted of 148 patients with 152 breast cancers.
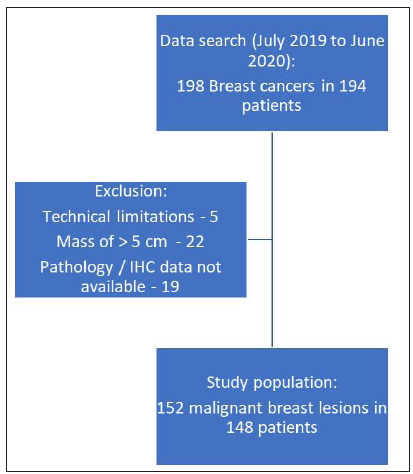
- Patient flow in our study. IHC: Immunohistochemistry.
The patients underwent ultrasound and SWE using SuperSonic® Aixplorer ultrasound device (SuperSonic Imagine, Aix-en-Provence, France) equipped with a linear array transducer (4-15 MHZ). The ultrasound and SWE were performed by one of two breast imaging specialists who possessed a minimum of five years’ experience in this field and who follow World Federation of Ultrasound in Medicine and Biology (WFUMB) on optimal performance of SWE.[18] Bilateral Digital Breast Tomosynthesis (DBT) and Full Field Digital Mammography (FFDM) were also performed on all patients using the Mammomat Inspiration system (Siemens Healthcare, Erlangen, Germany). Before the evaluation of the images for various criteria, such as correct placement of ROI, Q box, and ROI size of 1–3 mm, documentation of all B-mode features on ultrasound was assessed using images from the PACS.
Ultrasound data
The B-mode parameters, as delineated by the ACR BIRADS (fifth edition) Lexicon, were recorded.[19] These parameters encompass size, shape, margins, posterior features, and the presence or absence of calcifications. Traditionally, in SWE the hardest area is coded as red and the softest area is coded as blue.[18] The initial region of interest (ROI) was positioned in the most rigid section of the lesion identifiable by its red color. Conversely, the second ROI was placed in the adjacent normal parenchyma, which appeared as blue, representing the softest portion within the field of view (FOV). The quantitative aspects of SWE, including mean, maximum, minimum, standard deviation (SD), and ratio, were documented.
Pathological data
In addition to the stage of the tumor, molecular subtyping, and proliferation index (Ki-67), several pathological prognostic factors were observed. These factors comprised pathological type, grade, lymphovascular invasion, and the presence of lymph nodal involvement. The tumors were further categorized into four subtypes: Luminal A (ER+, PR+, HER2-, Ki-67 < 14%), Luminal B (ER+, PR+, HER2-, Ki-67 > 14%), Luminal B-like or triple positive (ER+, PR+, HER2+, Ki-67 any value), and basal-like triple negative (ER-, PR-, HER2-, Ki-67 any value). In this study, a cut-off value of 20% for Ki-67 was assigned to differentiate between low and high values for statistical analysis with reference to a prior study.[20]
Statistical analysis
The calculation was performed to determine the correlation between the five quantitative parameters on SWE and various factors such as molecular subtyping, tumor grade, lymphovascular invasion, lymph node metastasis, and Ki-67, which are known to have prognostic implications. The correlation between these quantitative parameters and specific ultrasound features obtained through B-mode ultrasonography (USG), including tumor margins, posterior features, the presence of calcifications, and the presence of mass/non-mass abnormalities, was also calculated. Analysis of Variance (ANOVA) was used when there were more than two groups, while an independent sample test was employed in cases with two groups.
To determine the correlation between B-mode features (i.e., margins and posterior features) and SWE parameters, specifically within the hormone positive and TNBC subtypes, an independent sample test was conducted.
In the HER2 positive subgroup, the correlation between the presence or absence of hormone positivity and the presence of calcifications as well as SWE parameters was calculated using an independent samples test.
RESULTS
We conducted an analysis on 152 malignant breast lesions in 148 patients. The baseline characteristics of the study population are described in Table 1. The most prevalent histopathological type was invasive ductal carcinoma, not otherwise specified (NOS) 84.2% (128/152), and the most common molecular subtype was luminal B type 43.4% (66/152).
| Parameter | Value n (%) |
|---|---|
| Age | |
| Mean | 54.8 years |
| Range | 30-84 years |
| Morphological abnormality in USG | |
| Non-mass abnormality | 11 (7.2%) |
| Mass | 141 (92.8%) |
| Mass margins | |
| Circumscribed | 22 (15.6%) |
| Microlobulated | 40 (28.36%) |
| Indistinct | 26 (18.43%) |
| Angular | 13 (9.92%) |
| Spiculated | 40 (28.36%) |
| Posterior features | |
| Shadowing | 39 (25.7%) |
| No features | 82 (53.9%) |
| Enhancement | 31 (20.4%) |
| Calcification | |
| Absent | 103 (67.8%) |
| Present | 49 (32.2%) |
| Histopathology | |
| DCIS with microinvasion | 5 (3.3%) |
| Invasive ductal carcinoma, Not | 128 (84.2%) |
| Otherwise Specified | |
| Invasive lobular carcinoma | 8 (5.3%) |
| Medullary carcinoma | 4 (2.6%) |
| Papillary carcinoma | 7 (4.6%) |
| Molecular subtypes | |
| Luminal A | 12 (7.9%) |
| Luminal B | 66 (43.4%) |
| Luminal B-like | 19 (12.5%) |
| HER2 enriched | 25(16.4%) |
| Triple negative | 30 (19.7%) |
| Grade | |
| I | 16 (10.5%) |
| II | 70 (46.1%) |
| III | 66 (43.4%) |
| Lymphovascular invasion | |
| Absent | 87 (57.2%) |
| Present | 65 (42.8%) |
| Lymph-node metastasis | |
| Absent | 64 (42.1%) |
| Present | 88 (57.9%) |
DCIS: Ductal Carcinoma In Situ.
SWE based on histopathological subtypes
Invasive ductal carcinomas, NOS revealed significantly higher mean, minimum, and maximum values on SWE (240, 189, and 268 kPa, respectively) compared to other histological subtypes (187, 153, and 215 kPa, respectively) with a P value of < 0.05.
SWE based on other prognostic factors
No significant difference in mean elastography values were noted between low and high Ki-67 levels (mean values of 224 and 235 kPa, respectively, P value of 0.239), presence or absence of lymphovascular invasion (mean values of 233 and 230 kPa, respectively, P value of 0.668), presence or absence of lymph-nodal metastasis (mean values of 233 and 229 kPa, respectively, P value of 0.645), and the grade of the tumor (mean values of 241, 233, and 227 kPa in grade 1, 2, and 3 tumors, respectively, P value of 0.533).
SWE based on morphology
Lesions appearing as non-mass abnormalities exhibited considerably low mean, minimum, and maximum elastography values and SWE ratio in contrast to lesions presenting as masses (as depicted in Table 2 and Figure 2). This difference was found to be statistically significant.
| Morphological features | SWE parameters | ||||
|---|---|---|---|---|---|
|
Mean (kPa) Mean (SD) |
Minimum (kPa) Mean (SD) |
Maximum (kPa) Mean (SD) |
SD Mean (SD) |
Ratio Mean (SD) |
|
| Non-mass abnormality | 191 (25.23) | 157 (25.92) | 216 (43.86) | 16 (14.05) | 9 (3.76) |
| Mass | 235 (52.92) | 186 (51.98) | 263 (52.96) | 21 (13.43) | 17 (11.79) |
| P value | 0.000 | 0.005 | 0.005 | 0.265 | 0.000 |
| Circumscribed masses | 191 (59.39) | 143 (45.44) | 224 (72.78) | 22 (13.04) | 21 (17.12) |
| Non-circumscribed masses | 243 (47.62) | 193 (49.44) | 270 (45.20) | 21 (13.54) | 16 (10.45) |
| P value | 0.000 | 0.000 | 0.008 | 0.74 | 0.09 |
| Posterior enhancement | 206 (65.02) | 163 (57.85) | 234 (70.41) | 19 (13.05) | 19 (13.50) |
| No posterior features | 233 (46.01) | 184 (43.01) | 264 (47.92) | 22 (14.04) | 16 (9.83) |
| Posterior shadowing | 247 (48.59) | 199 (56.18) | 271 (43.86) | 19 (13.05) | 15 (13.11) |
| P value | 0.004 | 0.011 | 0.008 | 0.262 | 0.218 |
| Calcifications absent | 231 (54.78) | 184 (53.32) | 258 (55.56) | 20 (14.2) | 17 (12.43) |
| Calcifications present | 231 (48.28) | 182 (46.37) | 262 (49.93) | 21 (11.94) | 15 (9.53) |
| P value | 0.991 | 0.762 | 0.693 | 0.640 | 0.342 |
SD: Standard Deviation, Numbers in bold represent P values.
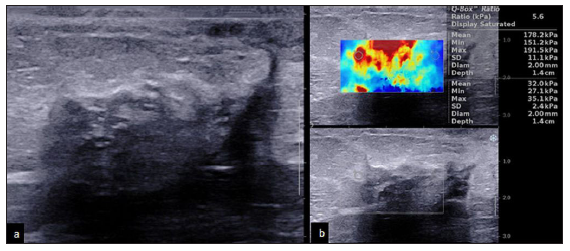
- A 55-year-old with ductal carcinoma in situ (DCIS) presenting as non-mass abnormality and low elastography values. (a) B-mode 2D ultrasound image showing a hypoechoic non-mass abnormality with posterior acoustic shadowing. (b) Elastography image showing peripheral hardness with lower elastography values (mean: 178 kPa, minimum: 151 kPa, and maximum: 192 kPa).
Among the masses, the correlation between morphological features such as margins, posterior features, calcifications, and SWE parameters were analyzed [Table 2]. Masses with circumscribed margins and masses showing posterior enhancement had significantly lower mean, minimum, and maximum elastography values compared to masses with non-circumscribed margins and no posterior enhancement. Mean elastography values did not demonstrate a significant difference with the presence or absence of calcifications.
SWE based on molecular subtypes
Hormone receptor-positive tumors exhibited markedly elevated mean, minimum, and maximum values in comparison to hormone receptor-negative tumors [Table 3, Figure 3]. TNBC had lower mean, minimum, and maximum values than non-triple-negative tumors [Table 3, Figure 4].
| Shear wave elastography values | TNBC (30) Mean (SD) | Non-TNBC (122) Mean (SD) | P value | HR positive cancers (97) Mean (SD) | HR negative cancers (55) Mean (SD) | P value |
|---|---|---|---|---|---|---|
| Mean (kPa) | 211 (64.36) | 236 (48.36) | 0.020 | 239 (48.69) | 218 (56.83) | 0.016 |
| Minimum (kPa) | 164 (52.50) | 188 (49.71) | 0.018 | 164 (52.50) | 188 (49.71) | 0.034 |
| Maximum (kPa) | 239 (69.59) | 265 (47.95) | 0.017 | 239 (69.59) | 265 (47.95) | 0.028 |
| SD | 20 (13.39) | 21 (13.55) | 0.666 | 20 (13.39) | 21 (13.55) | 0.741 |
| Ratio | 16 (11.36) | 16 (11.67) | 0.812 | 16 (11.36) | 16 (11.67) | 0.404 |
SD: Standard Deviation, TNBC: Triple Negative Breast Cancer, HR: Hormone Receptor.
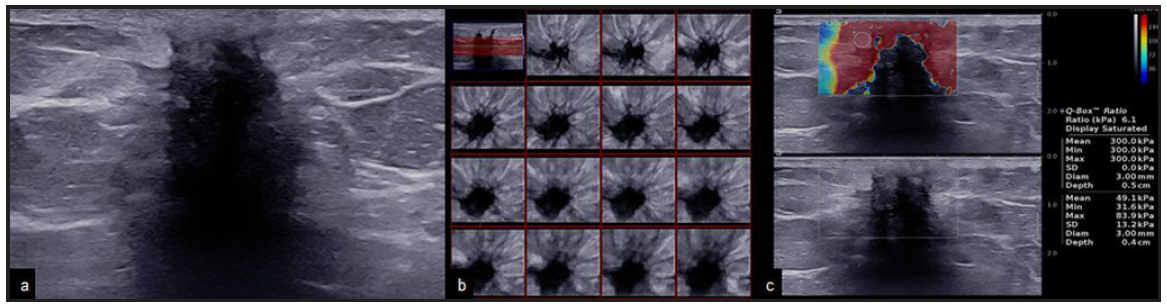
- A 59-year-old with hormone receptor-positive breast cancer. The mass shows spiculated margins and high elastography values. (a & b) B-mode 2D and 3D ultrasound images showing an irregular hypoechoic mass with spiculated margins and posterior acoustic shadowing. (c) Elastography image showing peripheral hardness of the lesion with high elastography values (mean: 300 kPa, minimum: 300 kPa, and maximum: 300 kPa).
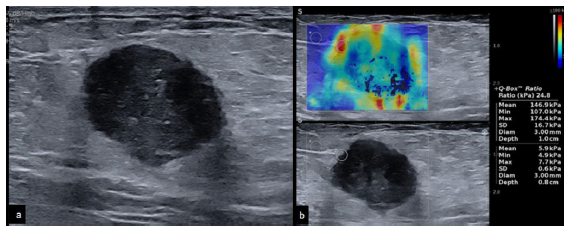
- A 40-year-old with triple negative breast cancer. The mass shows circumscribed margins and low elastography values. (a) B-mode 2D ultrasound image showing a round hypoechoic mass with circumscribed margins and posterior acoustic enhancement. (b) Elastography image showing peripheral hardness of the lesion with lower elastography values (mean: 147 kPa, minimum: 107 kPa, and maximum: 174 kPa).
Influence of morphology on SWE values within the molecular subtypes
With regards to hormone positive tumors (luminal A and B), the most prevalent margin type was spiculated (33/97 [34%]), while the least prevalent margin observed was circumscribed (8/97 [8.2%]). In the hormone positive subgroup, masses with circumscribed margins exhibited notably lower mean, minimum, and maximum elastography values in comparison to masses with non-circumscribed margins [Figure 5].
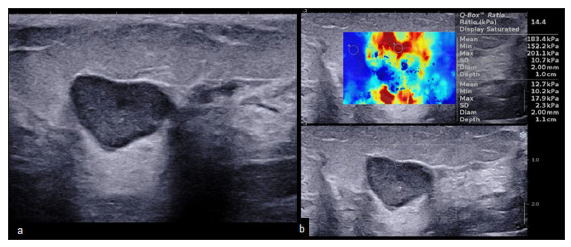
- A 45-year-old with hormone receptor-positive breast cancer. The mass shows circumscribed margins and low elastography values. (a) B-mode 2D ultrasound image showing an oval hypoechoic mass with circumscribed margins and posterior acoustic enhancement. (b) Elastography image showing peripheral hardness of the lesion (suspicious lesion despite the benign morphology) with lower elastography values (mean: 183 kPa, minimum: 152 kPa, and maximum: 201 kPa).
Conversely, among basal-like TNBC, the most common margin observed was circumscribed (10/30 [33.3%]) and spiculated margins were observed in 5 out of 30 cases (16.7%). The spiculated margins group displayed significantly higher mean and minimum elastography values compared to masses without spiculated margins [Table 4, Figure 6].
| Shear wave elastography values | Hormone positive breast cancers: masses (89/97) | P value | Triple negative breast cancers (30) | P value | ||
|---|---|---|---|---|---|---|
| Mean (SD) | Mean (SD) | |||||
| Margins | Circumscribed margins (8) | Non-circumscribed margins (81) | Spiculated margins (5) | Non-spiculated margins (25) | ||
| Mean (kPa) | 190 (31.47) | 249 (45.91) | 0.001 | 264 (59.37) | 201 (61.01) | 0.042 |
| Minimum (kPa) | 148 (31.40) | 197 (48.88) | 0.007 | 214 (72.94) | 154 (42.69) | 0.017 |
| Maximum (kPa) | 222 (49.48) | 276 (42.83) | 0.001 | 274 (58.89) | 232 (70.49) | 0.22 |
| SD | 21 (10.49) | 21 (13.76) | 0.918 | 13 (15.01) | 21 (12.99) | 0.24 |
| Ratio | 15 (11.8) | 16 (10.57) | 0.687 | 16 (6.39) | 16 (12.21) | 0.94 |
SD: Standard Deviation
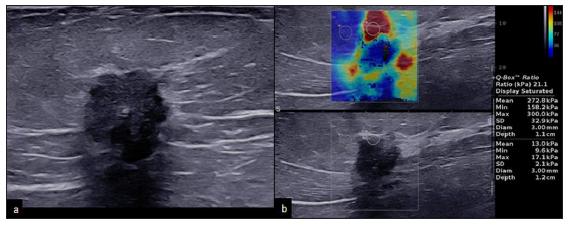
- A 65-year-old with triple negative breast cancer. The mass shows spiculated margins and high elastography values. (a) B-mode 2D ultrasound image showing an irregular hypoechoic mass with spiculated margins and posterior acoustic shadowing. (b) Elastography image showing peripheral hardness of the lesion with higher elastography values (mean: 273 kPa, minimum: 158 kPa, and maximum: 300 kPa).
In the basal-like triple negative tumors, there existed a statistically significant disparity in the mean and minimum elastography values among tumors with posterior acoustic enhancement where it was low (175 and 132 kPa, respectively) in comparison to the higher value in tumors without posterior enhancement (230 and 180 kPa, respectively).
In HER2 strong positive tumors, the presence or absence of calcifications (mean values of 228 and 236 kPa, respectively) did not exhibit any significant correlation (P value of 0.590). Similarly, the hormone receptor status also did not exhibit any significant correlation (P value of 0.244) with mean elastography values (242 and 225 kPa in ER positive and ER negative tumors, respectively).
DISCUSSION
The role of SWE in the assessment of solid masses and in distinguishing between benign and malignant masses has been established in multiple studies in the literature.[21–23] However, its role in molecular subtyping and other unfavorable prognostic factors, like Ki-67, LVI, LN status, and tumor grade, has yielded varying results in existing literature.[10–17] The reason for variable results in different studies may be due to the lack of studies investigating a correlation between B-mode features (morphology) and the elastography values within different molecular subtypes, constant development in the shear wave technology, and variations across different SWE units.
In our study, hormone receptor-positive tumors exhibited higher elastography values and basal-like TNBC had lower elastography values [Figure 7]. Numerous studies have supported this finding.[13,24–28]
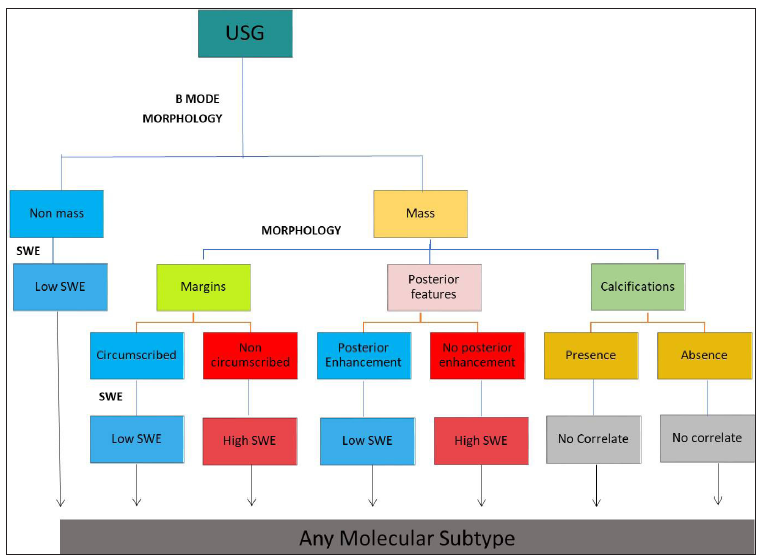
- Flow chart demonstrating that elastography is dependent on morphological characters and plays no significant role in predicting molecular subtypes. SWE: shear wave elastography.
We noted that the morphology and the pathological subtypes of the tumor appear to have a significant impact on elastography values in different molecular subtypes. To the best of our knowledge, this correlation has not been published earlier.
Tumors presenting as non-mass abnormalities or as non-ductal and in situ cancers were found to have significantly lower elastography values even when these tumors belonged to the hormone positive subgroup. However, several differences had been reported in the literature compared to our study. Ductal carcinoma in situ demonstrating lower elastography values compared to invasive ductal carcinomas has been reported by Bae et al.[29] However a study by Suvannarerg et al. showed no association with any tumor type,[30] while Brkljačić et al. concluded that lobular carcinomas had higher elastography values.[31]
In our study, 34% (33/97) of the HR positive cancers had spiculated margins and high SWE values and 33.3% (10/30) of basal-like TNBC had circumscribed margins and low SWE values which is consistent with prior literature.[32] An 8.2% (8/97) of HR positive tumors had circumscribed margins and 16.7% (5/30) of basal-like TNBC had spiculated margins (atypical morphology) and had low and high SWE values, respectively.
The above subset of HR positive and basal-like TNBC that exhibited atypical morphological characteristics and non-ductal pathological subtypes also had atypical elastography values. This particular discrepancy in elastography values across various molecular subtypes of breast cancer, contingent upon the morphology, has not been documented in the published literature.
Our analysis revealed that HER2 positive cancers did not display any dominant morphological features and the presence of calcifications and hormone positivity did not have an impact on the elastography values. Figure 7 summarizes our results and demonstrates that elastography is dependent on morphological characteristics and plays no significant role in predicting molecular subtypes.
There are limitations to this study which include its retrospective nature and the fact that it was conducted at a single center. The entire study was conducted using a single shear wave unit, so the results may not be applicable to other units. Additionally, the number of non-ductal cancers in the study population was relatively low. While we have identified a few potential reasons for the discrepancy in elastography values among different molecular subtypes, it is evident that the cause is multifactorial and requires larger studies.
Conclusion
SWE values appear to be dominated by morphological features and the same was reflected as differences in values within the same molecular subtype. We therefore conclude that SWE independently does not correlate with the molecular subtypes and morphology seems to play a key role in elastography values.
Further investigation using a larger dataset and different SWE units may better establish the clinical utility of SWE in the assessment of different molecular subtypes of breast cancer.
Acknowledgements
We would like to acknowledge Dr. Jeevithan Shanmugam, MD, Professor in Community Medicine for statistical analysis.
Ethical approval
The research/study approved by the Institutional Review Board at Kovai Medical Center and Hospital Limited, number EC/AP/732/07/2019, dated 24/08/2019.
Declaration of patient consent
Patient’s consent not required as there are no patients in this study.
Financial support and sponsorship
Nil.
Conflicts of interest
There are no conflicts of interest.
Use of artificial intelligence (AI)-assisted technology for manuscript preparation
The authors confirm that there was no use of AI-assisted technology for assisting in the writing of the manuscript or editing of the manuscript and no images were manipulated using AI.
REFERENCES
- Heterogeneity in breast cancer. J Clin Invest. 2011;121:3786-8.
- [CrossRef] [PubMed] [PubMed Central] [Google Scholar]
- Molecular subtypes of breast cancer: A review for breast radiologists. J Breast Imaging. 2021;3:12-24.
- [CrossRef] [PubMed] [Google Scholar]
- Molecular classification of breast carcinoma: from traditional, old-fashioned way to a new age, and a new way. J Breast Health.. 2015;11:59-66.
- [CrossRef] [PubMed] [PubMed Central] [Google Scholar]
- Role of ultrasound in predicting the molecular subtypes of invasive breast ductal carcinoma. Egypt J Radiol Nucl Med. 2020;51:138. Available from: https://doi.org/10.1186/s43055-020-00240-z
- [CrossRef] [Google Scholar]
- Predicting molecular subtypes of breast cancer with mammography and ultrasound findings: Introduction of sono-mammometry score. Radiol Res Pract.. 2021;2021:6691958.
- [CrossRef] [PubMed] [PubMed Central] [Google Scholar]
- Magnetic resonance imaging correlation with molecular and epigenetic markers in assessment of breast cancer. Egypt Radiol Nucl Med. 2022;53
- [CrossRef] [Google Scholar]
- Ultrasound imaging morphology is associated with biological behavior in invasive ductal carcinoma of the breast. J Clin Imaging Sci. 2021;11:48.
- [CrossRef] [PubMed] [PubMed Central] [Google Scholar]
- Role of mammogram and ultrasound imaging in predicting breast cancer subtypes in screening and symptomatic patients. World J Clin Oncol. 2021;12:808-22.
- [CrossRef] [PubMed] [PubMed Central] [Google Scholar]
- Correlation of imaging findings with molecular subtypes of breast cancer. J Nepal Health Res Counc. 2023;21:71-5.
- [CrossRef] [PubMed] [Google Scholar]
- The value of shear wave elastography in the diagnosis of breast cancer axillary lymph node metastasis and its correlation with molecular classification of breast masses. Front Oncol. 2022;12:846568.
- [CrossRef] [PubMed] [PubMed Central] [Google Scholar]
- Predicting prognostic factors of breast cancer using shear wave elastography. Ultrasound Med Biol. 2014;40:269-74.
- [CrossRef] [PubMed] [Google Scholar]
- Shear-wave elastography of invasive breast cancer: Correlation between quantitative mean elasticity value and immunohistochemical profile. Breast Cancer Res Treat. 2013;138:119-26.
- [CrossRef] [PubMed] [Google Scholar]
- Application value of conventional ultrasound combined with shear wave elastography in diagnosing triple negative breast cancer. Gland Surg. 2021;10:1980-88.
- [CrossRef] [PubMed] [PubMed Central] [Google Scholar]
- Relationship of shear-wave elastography findings with breast cancer molecular subtypes and comparison with other radiological imaging techniques. Dokuz Eylül Üniversitesi Tıp Fakültesi Dergisi. 2023;37:37-47.
- [PubMed] [Google Scholar]
- Correlation of shear-wave elastography and apparent diffusion coefficient values in breast cancer and their relationship with the prognostic factors. Diagnostics (Basel). 2022;12:3021.
- [CrossRef] [PubMed] [PubMed Central] [Google Scholar]
- What shear wave elastography parameter best differentiates breast cancer and predicts its histologic aggressiveness? Ultrasonography 2021:265-73.
- [CrossRef] [Google Scholar]
- Correlation of shear-wave elastography parameters with the molecular subtype and axillary lymph node status in breast cancer. Clin Imaging. 2023;101:190-9.
- [CrossRef] [PubMed] [Google Scholar]
- WFUMB guidelines and recommendations for clinical use of ultrasound elastography: Part 2: Breast. Ultrasound Med Biol. 2015;41:1148-60.
- [CrossRef] [PubMed] [Google Scholar]
- ACR BI-RADS® Ultrasound. In: ACR BI-RADS® Atlas, Breast Imaging Reporting and Data System. Reston, VA: American College of Radiology; 2013.
- [Google Scholar]
- Predicting the expression level of Ki-67 in breast cancer using multi-modal ultrasound parameters. BMC Med Imaging.. 2021;21:150.
- [CrossRef] [PubMed] [PubMed Central] [Google Scholar]
- Shear-wave elastography in breast ultrasonography: The state of the art. Ultrasonography.. 2017;36:300-9.
- [CrossRef] [PubMed] [PubMed Central] [Google Scholar]
- Diagnostic performance of quantitative shear wave elastography in the evaluation of solid breast masses: Determination of the most discriminatory parameter. AJR Am J Roentgenol.. 2014;203:W328-36.
- [CrossRef] [PubMed] [Google Scholar]
- Breast mass characterization using shear wave elastography and ultrasound. Diagn Interv Imaging. 2018;99:699-707.
- [CrossRef] [PubMed] [Google Scholar]
- Accuracy of real-time shear wave elastography for assessing liver fibrosis in chronic hepatitis C: A pilot study. Hepatology (Baltimore, Md). 2012;56:2125-33.
- [CrossRef] [PubMed] [Google Scholar]
- Shear wave elastography in the diagnosis of thyroid nodules: Feasibility in the case of coexistent chronic autoimmune Hashimoto’s thyroiditis: Shear wave elastography and thyroid autoimmunity. Clin Endocrinol. 2012;76:137-41.
- [Google Scholar]
- Correlation between mammographic findings and corresponding histopathology: Potential predictors for biological characteristics of breast diseases. Cancer Science,. 2011;102:2179-85.
- [CrossRef] [PubMed] [Google Scholar]
- Elastographic features of triple negative breast cancers. Eur Radiol. 2016;26:1090-7.
- [CrossRef] [PubMed] [Google Scholar]
- Triple-negative breast cancers: Associations between imaging and pathological findings for triple-negative tumors compared with hormone receptor-positive/human epidermal growth factor receptor-2-negative breast cancers. Oncologist. 2013;18:802-11.
- [CrossRef] [PubMed] [PubMed Central] [Google Scholar]
- Prediction of invasive breast cancer using shear-wave elastography in patients with biopsy-confirmed ductal carcinoma in situ. Eur Radiol. 2017;27:7-15.
- [CrossRef] [PubMed] [Google Scholar]
- Diagnostic performance of qualitative and quantitative shear wave elastography in differentiating malignant from benign breast masses, and association with the histological prognostic factors. Quant Imaging Med Surg. 2019;9:386-98.
- [CrossRef] [PubMed] [PubMed Central] [Google Scholar]
- Shear-wave sonoelastographic features of invasive lobular breast cancers. Croat Med J. 2016;57:42-50.
- [CrossRef] [PubMed] [PubMed Central] [Google Scholar]
- Imaging features of breast cancer subtypes on mammography and ultrasonography: An analysis of 479 patients. Indian J Surg Oncol. 2022;13:931-38.
- [CrossRef] [PubMed] [PubMed Central] [Google Scholar]