

Translate this page into:
Augmenting breast cancer diagnosis: Incorporating MRI for the assessment of major molecular subtypes


*Corresponding author: Meghana Meghavath, Department of Radio-diagnosis, NRI Academy of Medical Sciences, Guntur, India. meghavathmeghana.25@gmail.com
-
Received: ,
Accepted: ,
How to cite this article: Meghavath M, Gorantla R, Danaboyina AR. Augmenting breast cancer diagnosis: Incorporating MRI for the assessment of major molecular subtypes. Indian J Breast Imaging 2023;1:15-24.
Abstract
Objectives:
Breast cancer (BC) is one of the commonly encountered cancer in women around the world. It is a diverse medical disorder with multiple molecular subtypes that respond differently to therapy and have different prognoses. Subjects with the same stage of cancer and identical histological findings, on the other hand, can have disparities in clinical features and prognosis. Luminal A, Luminal B, Human epidermal growth factor receptor 2 (HER2) enriched, and triple-negative molecular subtypes were identified using novel technologies in expression analysis with DNA microarray. The precise identification of these subtypes is crucial for tailoring appropriate treatment strategies and improving patient outcomes. Dynamic contrast-enhanced magnetic resonance imaging (DCEMRI) is an excellent imaging technique for determining the extent of disease in BC patients prior to surgery. DECMRI with gadolinium-based contrasts is now the most sensitive identification tool for diagnosis, and it can be used in conjunction with mammography and ultrasound (USG). It aids in the detection of lesions that are not visible using other approaches.
Material and Methods:
Cross-sectional, observational study done over a period of 1 year.
Sample size: 50
Inclusion criteria:
Patients with morphological features of Breast Imaging Reporting and Data System (BI-RADS) 4b,4c,5 on USG or mammogram. Patients with malignancy confirmed through biopsy - BI-RADS 6. Patients aged above 18 years. Patients who provided informed consent to participate in the study.
Exclusion criteria:
Pregnant and lactating women. Patients with pacemakers, prosthetic heart valves, cochlear implants, or any metallic implants. Patients having a history of claustrophobia. Patients with prior surgery in the breast, hormonal therapy, radiation, or chemotherapy. Patients with previous allergic or anaphylactoid reactions to a gadolinium-based contrast. Patients with altered renal function test and estimated glomerular filtration rate <30 mL/min/1.73 mm2.
Results:
There was a substantial relationship between shape and molecular subtype. The majority of the luminal type of cancers was irregular, whereas the basal type was round. There was no link found between margin and molecular subtypes. Noncircumscribed margins, on the other hand, were more common in luminal subtypes. Internal enhancement and molecular subtypes were found to be significantly related. Rim enhancement was more prevalent in the basal subtype. According to ANOVA analysis, there was a significant relationship between volume and molecular subtypes. At the time of presentation, Luminal B tumors had a significant tumor volume.
Conclusion:
In conclusion, MRI plays a pivotal role in the evaluation of molecular subtypes of breast cancer, providing valuable information for personalized treatment decisions.
Advancements in MRI technology and radiogenomics hold great promise for enhancing subtype-specific characterization and improving patient outcomes.
Keywords
Breast Magnetic Resonance Imaging
Dynamic Contrast Enhanced Magnetic Resonance Imaging
Luminal type breast cancer
HER2 enriched breast cancer
Triple negative breast cancer

INTRODUCTION
Breast cancer (BC) is one of the most commonly encountered cancers in women around the world. It is a diverse medical disorder with multiple molecular subtypes that respond differently to therapy and have different prognoses. Patients with the same stage of cancer and similar histological findings can present with different clinical features having varying prognosis. Luminal A, Luminal B, Human epidermal growth factor receptor 2 (HER2) enriched, and triple-negative molecular subtypes were identified using novel technologies in expression analysis with DNA microarray.[1,2] The precise identification of these subtypes is crucial for tailoring appropriate treatment strategies and improving patient outcomes. Dynamic contrast-enhanced magnetic resonance imaging (DCEMRI) is an excellent imaging technique for determining the extent of disease in BC patients prior to surgery. DECMRI with gadolinium-based contrasts is now the most sensitive identification tool for diagnosis, and it can be used coupled with mammography and ultrasound (USG). It aids in the detection of lesions not visible using other approaches.
Luminal A has a low proliferation index (Ki-67) and accounts for 50–60% of breast cancers. It has the best outlook. Luminal B has a high Ki-67 index expression and accounts for 20% of BC cases. In comparison to Luminal A, it has a bad prognosis. HER2 is not overexpressed in Luminal B. HER2+ types account for 10% of BCs and are distinguished by poor hormone receptor expression. They have higher HER2/neu gene expression. The triple-negative subtype accounts for 7–16% of breast cancer cases and is distinguished by the absence of hormone receptor expression and low HER2+ expression. It demonstrates increased expression of high-molecular-weight cytokeratin genes. It is a less differentiated invasive carcinoma that accounts for 70% of BCs. HER2+ and triple-negative cancers respond better to chemotherapy but have lower survival rates.[3–5]
BC has surpassed lung cancer as the most prevalent global cancer in 2020, with around 2.3 million new cases, accounting for 11.7% of all cancer cases.[6] The global burden may exceed 2 million by 2030.[7] From 1965 to 1985, the frequency increased by approximately 50%.[8] Between 1990 and 2016, the incidence of BC in India grew by 39.1%, with increases recorded in all states.[9] According to Globocan data from 2020, BC accounted for 13.5% of all malignancies and 10.6% of all fatalities.[10] There have been few investigations on the use of DCEMRI on breast cancer. As a result, the purpose of this study was to look at the effectiveness of DCE MRI in assessing molecular subtypes of BC.
The current study was done at our hospital NRI Medical College and General Hospital, Chinakakani, which is equipped with 1,100 beds. All necessary facilities were available in our department for checking all the study parameters. Around 80 women presented to the Radiodiagnosis department with suspected breast carcinoma during the study duration. From these patients, study patients were recruited.
Aim: To assess molecular subtypes of breast cancer using DCE-MRI.
Objectives
-
To evaluate morphological features of diagnosed breast cancer using MR BI-RADS lexicon.
-
To evaluate the functional characteristics of diagnosed breast cancer using the MR BI-RADS lexicon.
-
To correlate MRI findings of breast cancer with immunohistochemistry findings.
MATERIALS AND METHODS
This study was done in the Department of Radiology, NRI Medical College, Chinakakani.
Study period: 12 months; from April 2021 to April 2022.
Type of study: Cross-sectional, observational study.
Source of data: After getting permission from the Institutional Ethics Committee (IEC), patients with suspected breast masses referred to the radiology department were taken as a study sample.
Sampling procedure: Convenience sampling was employed. It is a kind of nonprobability sampling. The sample was drawn from the part of the population that is close to hand or convenient.
Sample size calculation: As per the American Cancer Society, the prevalence of breast cancer among invasive cancers was 30% among women.[11]
The sample size is calculated as N = Z2PQ/E2.
N = sample size, P = prevalence, P = 30%, Q = 1–P, E = Error: 10%, 85% confidence limits, N = 44. Forty-four is the minimum size.
So, we included 50 patients in this study, considering a few losses to follow-up. All 50 patients provided consent for the study.
Inclusion criteria
-
Patients with morphological features of BI-RADS 4b,4c,5 on USG or x-ray mammography.
-
Patients with biopsy-proven malignancy – BI-RADS 6.
-
Patients aged above 18 years.
-
Patients who provided informed consent to participate in the study.
Exclusion criteria
-
Pregnant and lactating women.
-
Patients with pacemakers, prosthetic heart valves, cochlear implants, or any metallic implants.
-
Patients having a history of claustrophobia.
-
Patients with prior surgery in the breast, hormonal therapy, radiation, or chemotherapy.
-
Patients with previous allergic or anaphylactoid reactions to a gadolinium-based contrast.
-
Patients with altered renal function test and estimated glomerular filtration rate <30 mL/min/1.73 mm2.
Exclusion criteria were based on oral history from patients, and available medical records.
Materials used
Equipment: MRI was done using the clinical 1.5 Tesla Signa Explorer system (General electrical medical systems, NRI general hospital) with a dedicated 16-channel breast coil. No compression was applied.
An intravenous gadolinium-based contrast agent was delivered at a dose of 0.2 mmol/kg and flushed with 20 mL saline.
Methodology
All patients were investigated on a 1.5 Tesla GE SIGNA EXPLORER MRI machine with a dedicated 16-channel breast coil and no compression.
-
o
The patient was kept in a prone position. MRI examination included image acquisition followed by post-processing.
-
o
The following sequences were obtained: axial – T1 FSE, T2 FRFSE, T2 STIR. Sagittal – STIR, both breasts.
-
o
Diffusion-weighted images were obtained using diffusion-weighted echo planar imaging sensitizing diffusion gradients with b value of 800 s/mm2.
-
o
Dynamic study post gadolinium T1WI Fat sat (vibrant multiphase) was obtained in an axial plane. Pre-contrast fat-suppressed T1W gradient echo images were first obtained and this was followed by intravenous contrast injection.
-
o
Contrast material varied over time. Gadobutrol 0.2 mmol/kg body weight was injected as a bolus, followed by a flush of 20 mL of saline.
-
o
Gradient-echo images were obtained at 1-minute intervals, till 6 minutes.
-
o
Post processing was done by digitally subtracting the precontrast images from the sequential post-contrast images.
-
o
Kinetic analysis was done using the mean curve technique.
-
o
MR mammography reporting was done using ACR MRI BI-RADS Lexicon 5th edition.
-
o
All the patients were followed-up for histopathology and immunohistochemistry correlation.
Statistical analysis
The acquired data was imported into Excel 2019, and the analysis was performed using Excel 2019 and the program Epi info version 7.2.5.
The findings were presented in descriptive and inferential statistics.
A probability value of less than 0.05 was deemed statistically significant. Frequencies and percentages were also employed. The mean and standard deviation of continuous variables were determined. The chi-square test was used to determine categorical parameters.
Results
Molecular subtype: 36% patients were found to be Luminal A, 24% as basal, 20% as HER2 enriched and another 20% as Luminal B type of molecular subtypes in our study with 50 patients.
Association between shape and molecular subtype: [Table 1] [Figure 1] There was a significant association between shape and molecular subtype. It was irregular in most of the luminal type of carcinoma, round in the basal type.
| Molecular subtype | |||||||
|---|---|---|---|---|---|---|---|
| Shape | Bas al | HER2 enriched | Luminal A | Luminal B | Total | ||
| Irregular | 2 | 5 | 10 | 4 | 21 | ||
| Oval | 1 | 0 | 2 | 1 | 4 | ||
| Round | 10 | 5 | 6 | 5 | 25 | ||
| Total | 12 | 10 | 18 | 10 | 50 | ||
| df | Probability | Chi-Squared |
|---|---|---|
| 27.751 | 12 | 0.006 |
HER2: Human epidermal growth factor receptor 2
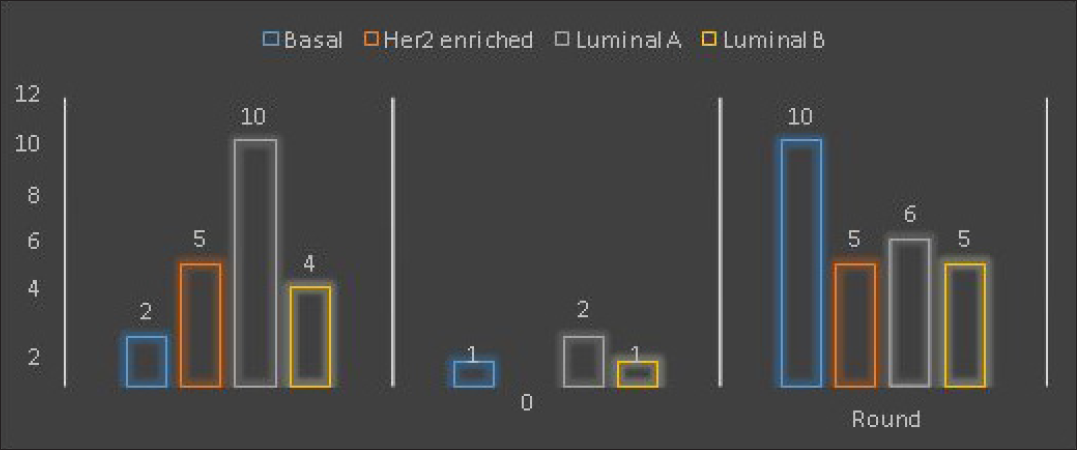
- Shape and molecular subtypes.
Association between margin and molecular subtype: [Table 2] There was no significant association between margin and molecular subtypes. However circumscribed margins were more commonly seen in luminal subtypes.
| Molecular subtype | |||||||
|---|---|---|---|---|---|---|---|
| Margin | Bas al | HER2 enriched | Luminal A | Luminal B | Total | ||
| C | 4 | 4 | 5 | 1 | 14 | ||
| NC | 8 | 6 | 13 | 9 | 36 | ||
| Total | 12 | 10 | 18 | 10 | 50 | ||
| Single Table Analysis | ||
|---|---|---|
| Chi-Squared | df | Probability |
| 2.4912 | 3 | 0.4769 |
HER2: Human epidermal growth factor receptor 2
Association between internal enhancement and molecular subtype: [Table 3] [Figure 2] There was a significant association between internal enhancement and molecular subtype. Rim enhancement was more commonly seen in a basal subtype.
| Molecular subtype | |||||||
|---|---|---|---|---|---|---|---|
| Internal enhancement | Bas al | HER2 enriched | Luminal A | Luminal B | Total | ||
| Heterogeneous | 5 | 7 | 16 | 9 | 37 | ||
| Rim | 7 | 3 | 2 | 1 | 13 | ||
| Total | 12 | 10 | 18 | 10 | 50 | ||
| Single Table Analysis | ||
|---|---|---|
| Chi-Squared | df | Probability |
| 27.3507 | 12 | 0.0069 |
HER2: Human epidermal growth factor receptor 2

- Internal enhancement and molecular subtypes.
Association between kinetic curve assessment and molecular subtype: [Table 4] There was no significant association between kinetic curve assessment and molecular subtype.
| Molecular subtype | |||||||
|---|---|---|---|---|---|---|---|
| Kinetic curve assessment | Bas al | HER2 enriched | Luminal A | Luminal B | Total | ||
| Type I | 0 | 0 | 2 | 0 | 2 | ||
| Type II | 0 | 3 | 4 | 2 | 9 | ||
| Type III | 12 | 7 | 12 | 8 | 39 | ||
| Total | 12 | 10 | 18 | 10 | 50 | ||
| Chi-Squared | df | Probability |
|---|---|---|
| 8.3571 | 9 | 0.4986 |
HER2: Human epidermal growth factor receptor 2
Association between volume and molecular subtypes: [Table 5] There was a significant association between volume and molecular subtypes, as per ANOVA analysis. Tumor volume was calculated by approximating the tumor into an ellipsoid and taking the maximum dimensions of the tumor in the formula: V ≈ (4/3) × π × (L/2) × (W/2) × (H/2). L = length, W = width, and H = height of the tumor.
| Molecular subtype and volume | |||||
|---|---|---|---|---|---|
| Molecular subtype | Observation | Total | Mean | Variance | Standard deviation |
| Basal | 12.000 | 460.861 | 38.405 | 805.9407 | 28.389 |
| 0 | 0 | 1 | 1 | ||
| HER2 enriched | 10.000 | 390.183 | 39.018 | 2229.578 | 47.218 |
| 0 | 0 | 3 | 7 | 4 | |
| Luminal A | 18.000 | 417.208 | 23.178 | 830.0812 | 28.811 |
| 0 | 0 | 2 | 1 | ||
| Luminal B | 10.000 | 642.699 | 64.269 | 1996.135 | 44.678 |
| 0 | 0 | 9 | 7 | 1 | |
| ANOVA | ||||
|---|---|---|---|---|
| Variation | SS | df | MS | F statistic |
| Between |
10865.3481 7 |
3 |
3621.7827 2 |
2.73082 |
| Within |
61008.1580 4 |
4 6 |
1326.2643 1 |
|
| Total |
71873.5062 1 |
4 9 |
||
P-value = 0.044, SS: Sum of Squares, MS: Mean Squares
Association between T2 SI and molecular subtypes: [Table 6] There was a significant association between T2 signal intensity and molecular subtypes, as per chi-square analysis (p = 0.01)
| Molecular subtype | |||||||
|---|---|---|---|---|---|---|---|
| T2 signal intensity | Bas al | HER2 enriched | Luminal A | Luminal B | Total | ||
| Hyper | 11 | 8 | 16 | 4 | 39 | ||
| Hypo | 1 | 2 | 2 | 6 | 11 | ||
| Total | 12 | 10 | 18 | 10 | 50 | ||
| Chi-Squared | df | Probability |
|---|---|---|
| 10.9881 | 3 | 0.0118 |
HER2: Human epidermal growth factor receptor 2
Association between DWI and molecular subtypes: [Table 7] There was no significant association between DWI and molecular subtypes, as per ANOVA analysis. Illustrative images from our observational study are depicted in [Figures 3a, 3b, 4a, 4b, 5a, 5b, 6a, 6b].
| Diffusion Weighted Imaging | |||||
|---|---|---|---|---|---|
| Molecular subtype | Observation | Total | Mean | Variance | Standard deviation |
| Basal | 12.000 | 7.6000 | 0.633 | 0.0442 | 0.2103 |
| 0 | 3 | ||||
| HER2 enriched | 10.000 | 7.1000 | 0.710 | 0.0854 | 0.2923 |
| 0 | 0 | ||||
| Luminal A | 18.000 | 10.260 | 0.570 | 0.0809 | 0.2844 |
| 0 | 0 | 0 | |||
| Luminal B |
10.000 0 |
6.6000 |
0.660 0 |
0.0871 | 0.2951 |
| ANOVA | ||||
|---|---|---|---|---|
| Variation | SS | df | MS | F statistic |
| Between |
0.1378 6 |
3 |
0.0459 5 |
0.61898 |
| Within |
3.4150 7 |
4 6 |
0.0742 4 |
|
| Total |
3.5529 3 |
4 9 |
||
P-value = 0.60627, SS: Sum of Squares, MS: Mean Squares

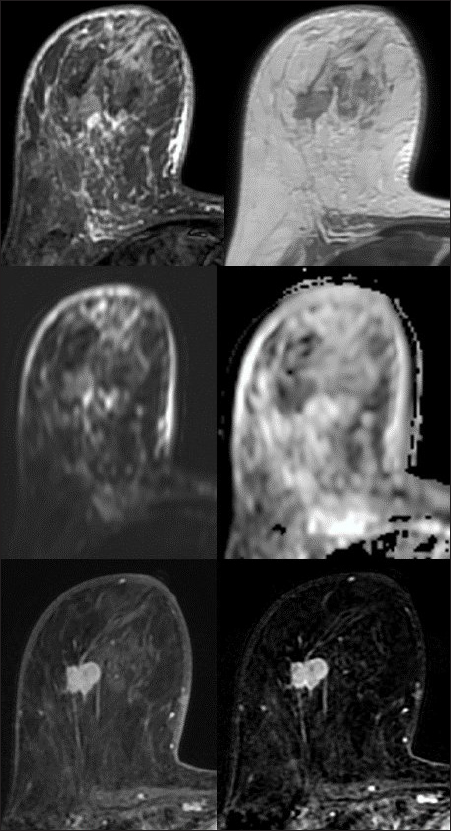
- Invasive ductal carcinoma – nonspecial type. Luminal A molecular subtype. A 74-year-old female with a lump in the left breast. MRI revealed an irregular mass with noncircumscribed margins. It is predominantly hyperintense on T2 and STIR images, and shows diffusion restriction with ADC values in the range of 0.5–0.8 × 10⁻³ mm2/s. Adjacent fibroglandular tissue shows mild STIR hyperintensity with no enhancement on contrast administration. It is showing moderate heterogeneous enhancement.

- Kinetic curve analysis shows rapid uptake in the initial phase. Persistent and plateau type of curve in delayed phase – Type I and II intensity-time curves.

- Invasive ductal carcinoma – nonspecial type. Medullary carcinoma. Luminal B molecular subtype. A 35-year-old female with a lump in the right breast. MRI revealed round to ovoid, noncircumscribed mass in posterior third depth at 1–2 o’clock position. It is predominantly hyperintense on T2 and STIR images with central cystic foci and shows diffusion restriction with ADC values in the range of 0.8–1.2 × 10⁻³ mm2/sec. It is showing central heterogeneous enhancement. Perilesional STIR hyperintensity shows minimal enhancement in contrast study. The mass is abutting the pectoralis muscle fibers posteriorly with few enhancing superficial muscles – suggestive of pectoralis muscle invasion.

- Kinetic curve analysis shows rapid uptake in the initial phase. Plateau type of curve in delayed phase – Type II intensity-time curve.
- Invasive ductal carcinoma – nonspecial type. HER2 enriched molecular subtype. A 46-year-old female with a lump in the right axilla. MRI revealed enlarged right breast. An irregular shaped mass with non-circumscribed margins in the middle third depth of the right breast. The mass is predominantly hyperintense on T2 and STIR images, and shows diffusion restriction with ADC values in the range of 0.3–0.4 × 10⁻³ mm2/s. It is showing moderate heterogeneous enhancement. Diffuse STIR hyperintensity in the fibroglandular tissue, pectoralis muscle, and subcutaneous planes.

- Kinetic curve analysis shows rapid uptake in the initial phase. Plateau and washout type of curve in delayed phase – Type II and III kinetic curves.

- Invasive ductal carcinoma – nonspecial type. Triple negative molecular subtype. A 72-year-old female with a lump in the right breast. MRI revealed exophytic, round circumscribed mass in the lower inner quadrant and the anterior third depth. It is showing T2 and STIR hyperintense signal with diffusion restriction and low ADC. Following contrast administration, it is showing rim enhancement with heterogeneous enhancement within. Perilesional and pectoralis edema noted in the form of STIR hyperintensities.

- Kinetic curve analysis revealed rapid uptake in the initial phase. Washout type of curves in delayed phase – Type III intensity – time curve.
Discussion
This was a cross-sectional, observational study undertaken at NRI Medical College & General Hospital, Chinakakani, a well-equipped tertiary care hospital. It lasted a year, from April 2021 to April 2022.
Patients over the age of 18 with suspicious breast masses who signed the informed consent form were included.
Patients with incomplete data, claustrophobia, cardiac pacemakers, artificial heart valves, cochlear implants, or any metallic implants, as well as those who were pregnant or lactating, were excluded.
According to the sample size, 50 patients were included.
All patients’ age, gender, mass, related characteristics, mass location, depth, margins, internal enhancement, ki67 index, MRI diagnosis, DWI, molecular subtype, kinetic curve assessment, ER, PR, HER2 status, and HPE findings were evaluated.
Mean and standard deviation were used to evaluate numerical parameters. Statistical tests were done using Epi info software, Microsoft Excel 2019.
The majority of the metrics were expressed as percentages and frequencies.
Age was expressed as a mean and standard deviation.
Chi-square analysis and the ANOVA test were used to determine the relationship between form, margins, internal enhancement, tumor volume, kinetic curves, T2 signal, and DWI and molecular subtype.
Molecular subtypes
Luminal-type (which is ER- or PR-positive) breast cancer is the most common type of BC. It is classified as luminal-A and luminal-B subtypes.
It was defined by low- (Ki-67 below 20) and high- (HER2-positive or Ki-67 more than 20) proliferation subtypes.[12–14]
Hormone receptors negative BCs include HER2-positive and basal subtypes. They were usually of higher grades with more Ki-67 indexes.[15–19]
HER2 is over-expressed in around 20% of BC cases and is linked to a poor prognosis, but it shows a good response to HER2 therapies.[20]
Basal-like BCs are usually triple negative BCs on semi-quantitative scoring.[21]
BC subtype can be easily diagnosed by immunochemical staining of the biopsy sample, but receptor expression may modify during treatment.
Breast MRI provides details not only on the cross-sectional morphology of the mass but also on functional features.
Comparison with other studies
Navarro et al. wanted to determine MRI findings as per BIRADS and to relate them with the molecular subtypes. A total of 201 women were included. There was a substantial relationship between the type of lesion on MRI and molecular subtypes. There was also a substantial relationship between lesion shape, mass enhancement, and margins with molecular subtypes.[22]
In our study, we found a considerable relationship between shape, internal enhancement, and molecular subtypes.
TNBC was discovered to be of high histologic grade, round in shape, with smooth margins and rim enhancement.
Luminal A was commonly of low grade, mostly irregular in shape.
Luminal B was more commonly seen as low grade with noncircumscribed margins.
Luminal A and B tumors had differences in imaging characteristics but were subtle. Further research and detailed comparative studies are needed to establish definitive patterns that distinguish these subtypes.
HER-2-enriched BCs were of moderate grade, and multicentric lesions were more present compared to other subtypes.
Osman NM et al. identified that TNBC was common in patients during their 4th decade of life. The age was comparatively less compared to ER and HER2+.[23]
Histologically, high-grade tumors were more common in luminal type B, HER2+, and TNBC types compared to luminal type A in studies of Lacroix BM et al. and Uematsu T et al.[24,25]
Luminal A tumors were more common and masses with an irregular shape, and heterogeneous enhancement was common in the study of Youk JH et al.[26]
Luminal A subtype of BC is linked to the best prognosis, with a 5-year survival rate above 80%. The excellent prognosis was due to the expression of steroid hormone receptor, which easily responds to hormonal therapy.
Agarwal G et al. and Grimm et al. found that multicentric disease was more common in Luminal B and HER2 positive tumors. They were linked to axillary adenopathy, edema compared to Luminal A, and TNBC showed more invasive behavior and distant metastasis.[27,28]
Blocked lymphatic nodes can be the reason for some kind of lymphatic obstruction in the breast which may explain the formation of pectoral edema.[29,30]
Systematic review of Kazama[31] was done on studies published from 2002 to 2021, 12,989 patients were included. The review found significant differences in time-intensity curve patterns between receptor statuses. There was no difference in type 3 curves between estrogen positive and negative cancers.
In nine studies, which included 1,070 lesions, there was a significant link in type 3 curves between HER 2-positive and -negative cancers (95% CI: [0.01, 0.14]).
Recommendations for future studies
-
Studies on patients aged below 18 years and above 70 years.
-
Multicenter studies of various tertiary care hospitals and specialized clinics can be done as more diverse patient populations can be involved.
-
Existing studies might be meta-analyzed.
-
A cost-effective analysis of imaging tests needed to detect breast lumps can be performed.
-
Research on various screening approaches for early identification of breast cancer can be conducted.
-
MRI findings can be compared to USG and mammogram findings in studies.
-
Studies on the prevalence of both benign and malignant breast lesions can be conducted.
-
It is possible to conduct studies detailing various imaging aspects of both benign and malignant tumors.
CONCLUSION
Breast MR Imaging helps in determining various molecular subtypes of breast cancer, especially in Luminal A. The mass shows that noncircumscribed margins and rim enhancement were more commonly seen in TNBC subtypes.
Conventional MRI features like time-intensity curve and mean ADC may have a limited role in predicting breast cancer subtypes. Sophisticated evaluation of tumor heterogeneity, more studies on recently introduced techniques, and standardized interpretation of images can improve noninvasive breast cancer molecular subtype classification.
This form of subtype classification also aids in the provision of customized treatment for breast cancer patients.
Declaration of patient consent
The authors certify that they have obtained all appropriate patient consent.
Financial support and sponsorship
Nil.
Conflicts of interest
There are no conflicts of interest.
Ethical approval
The author(s) declare that they have taken the ethical approval from IRB/IEC
Use of artificial intelligence (AI)-assisted technology for manuscript preparation
The authors confirm that there was no use of artificial intelligence (AI)-assisted technology for assisting in the writing or editing of the manuscript and no images were manipulated using AI.
References
- Molecular classification of infiltrating breast cancer: toward personalized therapy. Radiographics. 2014;34:11788-1195.
- [Google Scholar]
- Molecular pathology of breast cancer: what a pathologist needs to know. Am J Clin Pathol. 2012;138:7700-780.
- [Google Scholar]
- Role of MRI in the staging of breast cancer patients: does histological type and molecular subtype matter? Br J Radiol. 2015;88:20150458.
- [CrossRef] [PubMed] [PubMed Central] [Google Scholar]
- Global cancer Statistics 2020: GLOBOCAN estimates of incidence and mortality worldwide for 36 cancers in 185 countries. CA Cancer J Clin. 2021;71:209-249.
- [CrossRef] [PubMed] [Google Scholar]
- Breast cancer statistics, 2011. CA Cancer J Clin. 2011;61:409-418.
- [CrossRef] [PubMed] [Google Scholar]
- The burden of cancers and their variations across the states of India: the Global Burden of Disease Study 19900–2016. Lancet Oncol. 2018;19:1289-1306.
- [CrossRef] [PubMed] [PubMed Central] [Google Scholar]
- Iarc.fr. Available from: https://gco.iarc.fr/today/data/factsheets/populations/356-india-fact-sheets.pdf [Last accessed on 2022 Oct 15].
- Breast cancer statistics. J Natl Cancer Inst 2000;92:445. Available from: https://www.cancer.org/cancer/breast-cancer/about/how-common-is-breast-cancer.html [Last accessed on 2022 Nov 4].
- Tailoring therapies—Improving the management of early breast cancer: St Gallen International Expert Consensus on the primary therapy of early breast cancer. Ann Oncol. 2015;26:1533-1546.
- [CrossRef] [PubMed] [PubMed Central] [Google Scholar]
- Personalizing the treatment of women with early breast cancer: Highlights of the St Gallen International Expert Consensus on the primary therapy of early breast cancer. Ann Oncol. 2013;24:2206-2223.
- [CrossRef] [PubMed] [PubMed Central] [Google Scholar]
- Prognostic significance of the Ki67 scoring categories in breast cancer subgroups. Clin Breast Cancer. 2014;14:e323-e329.
- [Google Scholar]
- Imaging features of HER2 overexpression in breast cancer: A systematic review and meta-analysis. Cancer Epidemiol Biomark Prev. 2014;23:1464-83.
- [Google Scholar]
- Intravoxel incoherent motion magnetic resonance imaging for breast cancer: A comparison with benign lesions and evaluation of heterogeneity in different tumor regions with prognostic factors and molecular classification. Oncol Lett. 2018;16:5100-12.
- [CrossRef] [PubMed] [PubMed Central] [Google Scholar]
- Specific morphological features predictive for the basal phenotype in grade 3 invasive ductal carcinoma of breast. Histopathology. 2006;49:22-34.
- [CrossRef] [PubMed] [Google Scholar]
- Phenotypic evaluation of the basal-like subtype of invasive breast carcinoma. Mod Pathol. 2006;19:264-71.
- [CrossRef] [PubMed] [Google Scholar]
- MR imaging findings in molecular subtypes of breast cancer according to BIRADS system. Breast J. 2017;23:421-8.
- [CrossRef] [PubMed] [Google Scholar]
- Triple negative breast cancer: MRI features in comparison to other breast cancer sub types with correlation to prognostic pathologic factors. The Egyptian Journal of Radiology and Nuclear medicine. 2014;45:13099-1316.
- [Google Scholar]
- Radiological features of triple-negative breast cancers (73 cases) Diagn Interv Imaging. 2012;93:183-90.
- [CrossRef] [PubMed] [Google Scholar]
- Triple-negative breast cancer: correlation between MR Imaging and Pathologic findings. Radiology. ;250:6388-647.
- [Google Scholar]
- Triple – negative invasive breast cancer on dynamic contrast enhanced and diffusion – weighted MR imaging comparison with other breast cancer subtypes. Eur Radiol. 2012;22:17244-1734.
- [Google Scholar]
- MRI features of breast cancer: a correlation study with HER-2 receptor. Ann Oncol. 2007;18:1903-4.
- [CrossRef] [PubMed] [Google Scholar]
- Can breast cancer molecular subtype help to select patients for preoperative MR imaging? Radiology. 2015;274:352-8.
- [CrossRef] [PubMed] [Google Scholar]
- Estrogen receptor-negative invasive breast cancer: imaging features of tumors with and without human epidermal growth factor receptor type 2 overexpression. Radiology. 2008;246:367-75.
- [CrossRef] [PubMed] [Google Scholar]
- Breast cancer molecular subtype classifier that incorporates MRI features. J Magn Reson Imaging. 2016;44:122-9.
- [CrossRef] [PubMed] [PubMed Central] [Google Scholar]
- Breast cancer subtypes and quantitative magnetic resonance imaging: A systemic review. Life (Basel). 2022;12:490.
- [CrossRef] [PubMed] [PubMed Central] [Google Scholar]