

Translate this page into:
Using functional genomics and systems biology approach to understand breast cancer progression: An in-silico study

*Corresponding author: Ashok Sharma, Department of Biochemistry, All India Institute of Medical Sciences (AIIMS), New Delhi, India ashoksharma1202@gmail.com
-
Received: ,
Accepted: ,
How to cite this article: Kaushik P, Qazi S, Pandey R, Rath GK, Sharma A. Using functional genomics and systems biology approach to understand breast cancer progression: An in-silico study. Indian J Breast Imaging. doi: 10.25259/IJBI_13_2024
Abstract
Objectives
Breast cancer (BC) stands as the foremost malignancy among females, annually contributing to substantial mortality despite its often-asymptomatic nature. The latest GLOBOCAN 2024 data reveals Asia’s staggering burden, with 2,144,232 reported cases, prominently led by China (44%) and India (26%).
Materials and Methods
Gene expression datasets are retrieved from popular databases, namely NCBI’s Gene Expression Omnibus. Differential expression analysis was executed using an identified set of key genes implicated in breast cancer progression. Further exploration included a data pre-processing pipeline, disease-gene associations, principal component analysis, and Kaplan-Meier survival estimations, providing comprehensive insights into the functional roles of these genes within breast cancer pathways.
Results
RELB, PRDX5, CDKN1A, CST4, and UPP1 emerged as pivotal genes significantly influencing breast carcinoma progression in females. These findings underscore the critical roles of identified genes and advocate for their integration into a refined breast cancer network model.
Conclusion
Future research should focus on elucidating the specific functional attributes of RELB, PRDX5, CDKN1A, CST4, and UPP1 to enhance targeted therapeutic strategies and prognostic assessments in breast cancer management. Our research work not only advances our understanding of breast cancer biology but also highlights actionable targets for improved clinical outcomes and patient care.
Keywords
Breast cancer
Differentially expressed genes
Disease-gene associations
Gene regulatory network
Principal component analysis

INTRODUCTION
Breast cancer remains the most prevalent cancer among women worldwide, contributing significantly to cancer-related mortality. According to the latest GLOBOCAN 2024 statistics, there were an estimated 2.3 million new breast cancer cases globally, with Asia accounting for 2,144,232 breast cancer cases, with China and India representing 44% and 26% of the total, respectively.[1-4] This rising trend underscores critical gaps in medical infrastructure, early detection, and public awareness. The etiology of breast cancer can be widely categorized into two main factors: (a) intrinsic factors, which consist of genetic predispositions, age, family history, and epigenetic alterations, and (b) extrinsic factors, which consist of environmental exposures and lifestyle choices. Despite advancements in early detection methods, a significant number of breast cancer cases are diagnosed at advanced stages, primarily due to the overlap of symptoms with other benign conditions. The complexity of breast cancer biology necessitates a multidisciplinary approach to understanding its underlying mechanisms. In recent years, researchers have increasingly utilized a multidisciplinary approach to unravel the molecular basis of breast cancer. This approach integrates fields such as translational bioinformatics, epigenomics, molecular biology, and systems biology. These combined methodologies have facilitated the identification of key genes implicated in breast cancer development, including BRCA1, BRCA2, TP53, PTEN, and HER2.[5-7] These genes are crucial because they are involved in managing vital processes in our cells, including fixing damaged DNA, regulating the cell cycle, and initiating cell death.
Interestingly, the majority of these genes are also linked to other types of cancers like ovarian, colorectal, and lung cancers. This overlap suggests that there is a need to find markers that are specific to each type of cancer. Our focus is on finding genes with varying expression levels in breast cancer. The key genes were identified based on a multi-step process combining differential expression analysis and disease-gene association scores derived from DisGeNET. Genes were prioritized for their significant fold change log2 fold change (log2FC > ±0.5849, p < 0.05), known association with pathways of breast cancer, and functional annotations from curated databases, such as KEGG and GO, evaluating their possible connections to the disease, and carrying out principal component analysis (PCA) as well as Kaplan-Meier survival (KMS) estimations.[8,9] Our research work deploys both functional genomics and systems biology to comprehend breast cancer biology and identify actionable targets for improved clinical outcomes and patient care. In this study, our goal is to discover the main genes involved in the network biology of breast cancer.
MATERIALS AND METHODS
Data Retrieval
We retrieved the gene expression data for breast cancer obtained from the Gene Expression Omnibus (GEO) of the National Centre for Biotechnology Information (NCBI)[10,11] by using keyword search terms such as {"gene expression of breast cancer,” “gene expression of breast carcinoma,” and “gene expression of breast adenocarcinoma"} were used to identify relevant datasets for this study. The dataset quality depends on: (1) Tissue Type: It was most probably breast tumor biopsies. (2) Sample Size: The datasets likely ensured an appropriate sample size that is big enough to have solid statistical analysis. This is a must in uncovering the underlying patterns and correlations within the data. (3) Data Type: The datasets likely consisted of RNA-seq data because the study was based on transcriptomic profiling, which is best captured by RNA-seq.[12,13]
Data Retrieval and Data Pre-processing Pipeline
To ensure any results drawn were robust and reliable, a comprehensive array of pre-processing steps was applied post-gene expression datasets retrieval from GEO. Measures to enhance data quality and reproducibility, as well as improvements to analytical accuracy, were taken in these aspects:
a. Normalization: Normalization is a key step in the analysis of gene expression, making sure that all datasets have systematic biases removed and samples comparable. We applied “quantile normalization” to standardize gene expression levels, removing variability potentially caused by technical rather than biological conditions. In addition, the data were stabilized variance by using “log2 transformation” so that extreme value would not skew the results. It converts expression values to scale where fold changes (FCs) can be read easily.
b. Quality Control Measures: This was followed by a quality assessment of the retrieved datasets using widely acknowledged “FastQC,” a tool that assesses the quality of raw sequence data, and reports that highlighted information about quality and possible issues during sequencing runs, such as problems related to low-quality reads, adapter contamination, or GC content bias. After quality assessment of the posts, all the “low-quality reads” with a Phred score of less than 20 were deleted, hence keeping high-confidence data for future analysis. Reads containing adapter sequences or length that did not cut the criteria were discarded. We applied strict filtering criteria that eliminate “potential outliers” based on the application of combined statistical techniques, such as the Z-score technique. This ensures that mere extreme values, possibly resulting from technical artifacts, do not interfere with the overall analysis.
c. Data Filtering and Redundancy Reduction: At the other end, custom Python scripts removed the redundant and duplicated entries from the dataset. Modules of “NumPy” and “Pandas” were applied to speed up the cleansing of the data, hence preventing inconsistencies, thereby making it clean for analysis. All these involved the reduction of the process of redundancy by eliminating duplicate entries of genes, the emergence of data from many sources together, and standardization of naming conventions from datasets. These provided a chance for the consolidation of information and an improvement in the coherence of the dataset. To minimize biases introduced during filtering and normalization of data, we used very strict statistical techniques. Z-score filtering was used to identify and exclude outlier data points such that the variation retained for analysis was biologically relevant and not artifacts of technical inconsistencies. Quantile normalization was used to standardize gene expression levels across samples, reducing systematic biases arising from differences in sequencing depth or experimental conditions. These measures collectively ensured that the dataset was both high-quality and representative, enhancing the reliability of downstream analyses.
d. Use of Tools and Software: The pre-processing workflow is developed upon a few software tools and custom scripts. Regarding the quality checks, “FastQC” was used initially while trimming and cleaning of the sequence data were carried out with the help of “Trim Galore.” After the preliminary quality check, we prepared “Python scripts” to automate most of the phases of the pre-processing, such as the removal of low-quality reads, adapter trimming, and normalization. The scripts used pre-installed Python libraries, such as “math” to do log transformations and “NumPy” and “Pandas” to manipulate the data efficiently. It also aligned reads using tools such as HISAT2, which aligns mapped reads to the reference genome to ensure that gene expression data is properly aligned.
Differentially Expressed Genes (DEGs) Identification
Gene expression profiling was conducted on chosen datasets that included the methylation status of breast cancer samples. We executed pre-processing to reduce outliers and redundancy usually present in datasets. To identify significant DEGs, fold-change (FC) statistics and p-values were used. The FC approach identifies genes with altered expression between cancerous and normal samples. Genes with log2-FC values above 1 are upregulated, while those below 1 are downregulated (equivalent to a 2-fold difference). The threshold values for log2FC (≥ ±0.5849, equivalent to a 1.5-FC) and p-values (≤0.05) were set using a combination of prior research and exploratory analysis to ensure biological relevance and statistical rigor. Log2FC thresholds were chosen for the identification of genes with significant expression changes, which would reflect their potential participation in crucial pathways. The p-value cutoff was set to keep the false discovery rate (FDR) below 5% by using the Benjamini-Hochberg method. These values are well within the established ranges for transcriptomic studies and are generally considered to be suitable for the confident identification of differentially expressed genes.[14] The expression levels were calculated using the LogFC function in Python.[15] To maintain a FDR of 0.05, the Benjamini-Hochberg algorithm was applied to determine significant results. We applied the Benjamini-Hochberg (BH) procedure since this is the accepted method of handling FDR during high-throughput analyses, especially in differential gene expression. A more stringent method, like Bonferroni correction, makes it susceptible to false negatives; it is also one of the drawbacks of such adjustment. On the other hand, BH adjusts well between sensitivity and specificity. For this kind of analysis, with the main concern being the identification of biologically significant genes with less false positives, BH seems apt. Its compatibility with the large number of statistical tests performed ensures that the results would be powerful and reliable without being derogatory to the power to detect meaningful differences.
Pre-processing Pipeline of Gene Expression Data
It was necessary to guarantee that gene expression data retrieved for analysis was of high quality and reliable enough for our analysis. For this reason, we applied a broad pre-processing workflow on the retrieved datasets. Such a workflow included outlier detection, reduction of redundancy, and control of the FDR in differential gene expression analysis.
Outlier Detection and Reduction: Generally, outliers can significantly affect the outcome of a gene expression study and may lead to misleading conclusions. For these, we applied the use of the Z-score method for outlier detection. The expression values more than ±3 standard deviations from the mean were marked as possible outliers and checked for artifacts that could be derived from either technical reasons or sample anomalies. In such cases, the data points were removed. This ensured that the only maintained variations were biologically relevant, thus reducing downstream analysis errors.
Redundancy Reduction: The redundancy in the dataset, such as duplicated records of genes or variations in nomenclature, was resolved using custom-designed Python scripts that combined data from one or more sources, merged duplicate records, and standardized the nomenclature of gene identifiers. Thus, by reducing redundancy, each gene was represented only once, hence maintaining coherence and integrity within the dataset.
False Discovery Rate: During differential expression analysis, we utilized the Benjamini-Hochberg algorithm in regulating FDR with regards to minimizing false positives. This type of statistical approach will come into play in the estimation of adjusted p-values due to compensation for multiple comparisons and to be left with an expected proportion of false positives below a specified cutoff level of FDR < 0.05. Algorithmically, the p-values ranking adjusts to limit the type I errors to their chances. Consequently, the DEGs identified are more robust and reliable. It is with this approach that we confidently diagnosed those genes that were significantly upregulated or downregulated in the cancerous sample compared to the normal one. The p-value < 0.05 was employed to identify significant DEGs.
Disease-Gene Association Analysis Using DisGeNET
Statistical and computational methods were employed to evaluate the potential of seed genes for their connection to breast cancer. Genes significantly linked to this disease were identified and then analyzed in DisGeNET to explore their fundamental disease gene associations.[16] DisGeNET is used to identify and rank genes associated with human diseases. The final GDA score is computed by integrating these factors—Source Evidence Weight, Number of Sources, Type of Evidence, Data Provenance, and Citation Metrics, producing a numerical value that ranks the strength of each gene-disease association. Higher scores indicate a stronger, more reliable association. This scoring helps filter out less significant GDAs and focus on those with robust backing.
GDA Scoring and Interpretation
The GDA scores are numerical values that quantify the strength of the association between genes and diseases, based on a synthesis of evidence from multiple sources, including experimental studies, curated databases, and text-mined literature. Higher GDA scores indicate stronger associations. In our study, genes with GDA scores above 0.7 were considered highly associated with breast cancer, while scores between 0.5 and 0.7 indicated moderate associations. This thresholding allows for a nuanced understanding of the confidence level in each association.
Types of Evidence Considered
The scoring process incorporates various types of evidence, including:
Experimental Evidence: Support from functional studies, such as gene knockouts or overexpression experiments, demonstrating a direct role in disease mechanisms.
Genetic Evidence: Associations identified through genome-wide association studies (GWAS) or linkage studies that highlight genetic variants correlated with disease risk.
Literature Mining: Instances where gene-disease associations have been reported consistently in scientific publications, identified through advanced text-mining algorithms.
Curated Databases: Integration of data from authoritative resources such as UniProt, ClinVar, and the Comparative Toxicogenomics Database (CTD), ensuring that peer-reviewed information is incorporated into the scoring.
Methodology of GDA Score Calculation
DisGeNET aggregates evidence from these diverse sources to compute the final GDA score for each gene-disease association. This comprehensive approach enhances the robustness of the identified associations, facilitating a reliable framework for understanding the genetic underpinnings of breast cancer.
Principal Component Analysis and Kaplan-Meier Survival Estimation
These seed genes underwent expression analysis and Kaplan-Meier survival estimation. This was performed using online tools such as UALCAN,[17-19] and KM plots for breast cancer were constructed using KMplotter,[20] a tool that leverages data from GEO, TCGA, and EGA.[21] To facilitate comprehension of the analysis workflow, Figure 1 presents the complete workflow of the executed study. It is important to mention the use of the tools—UALCAN and KMplotter—in this section. These tools were deployed for the following features:
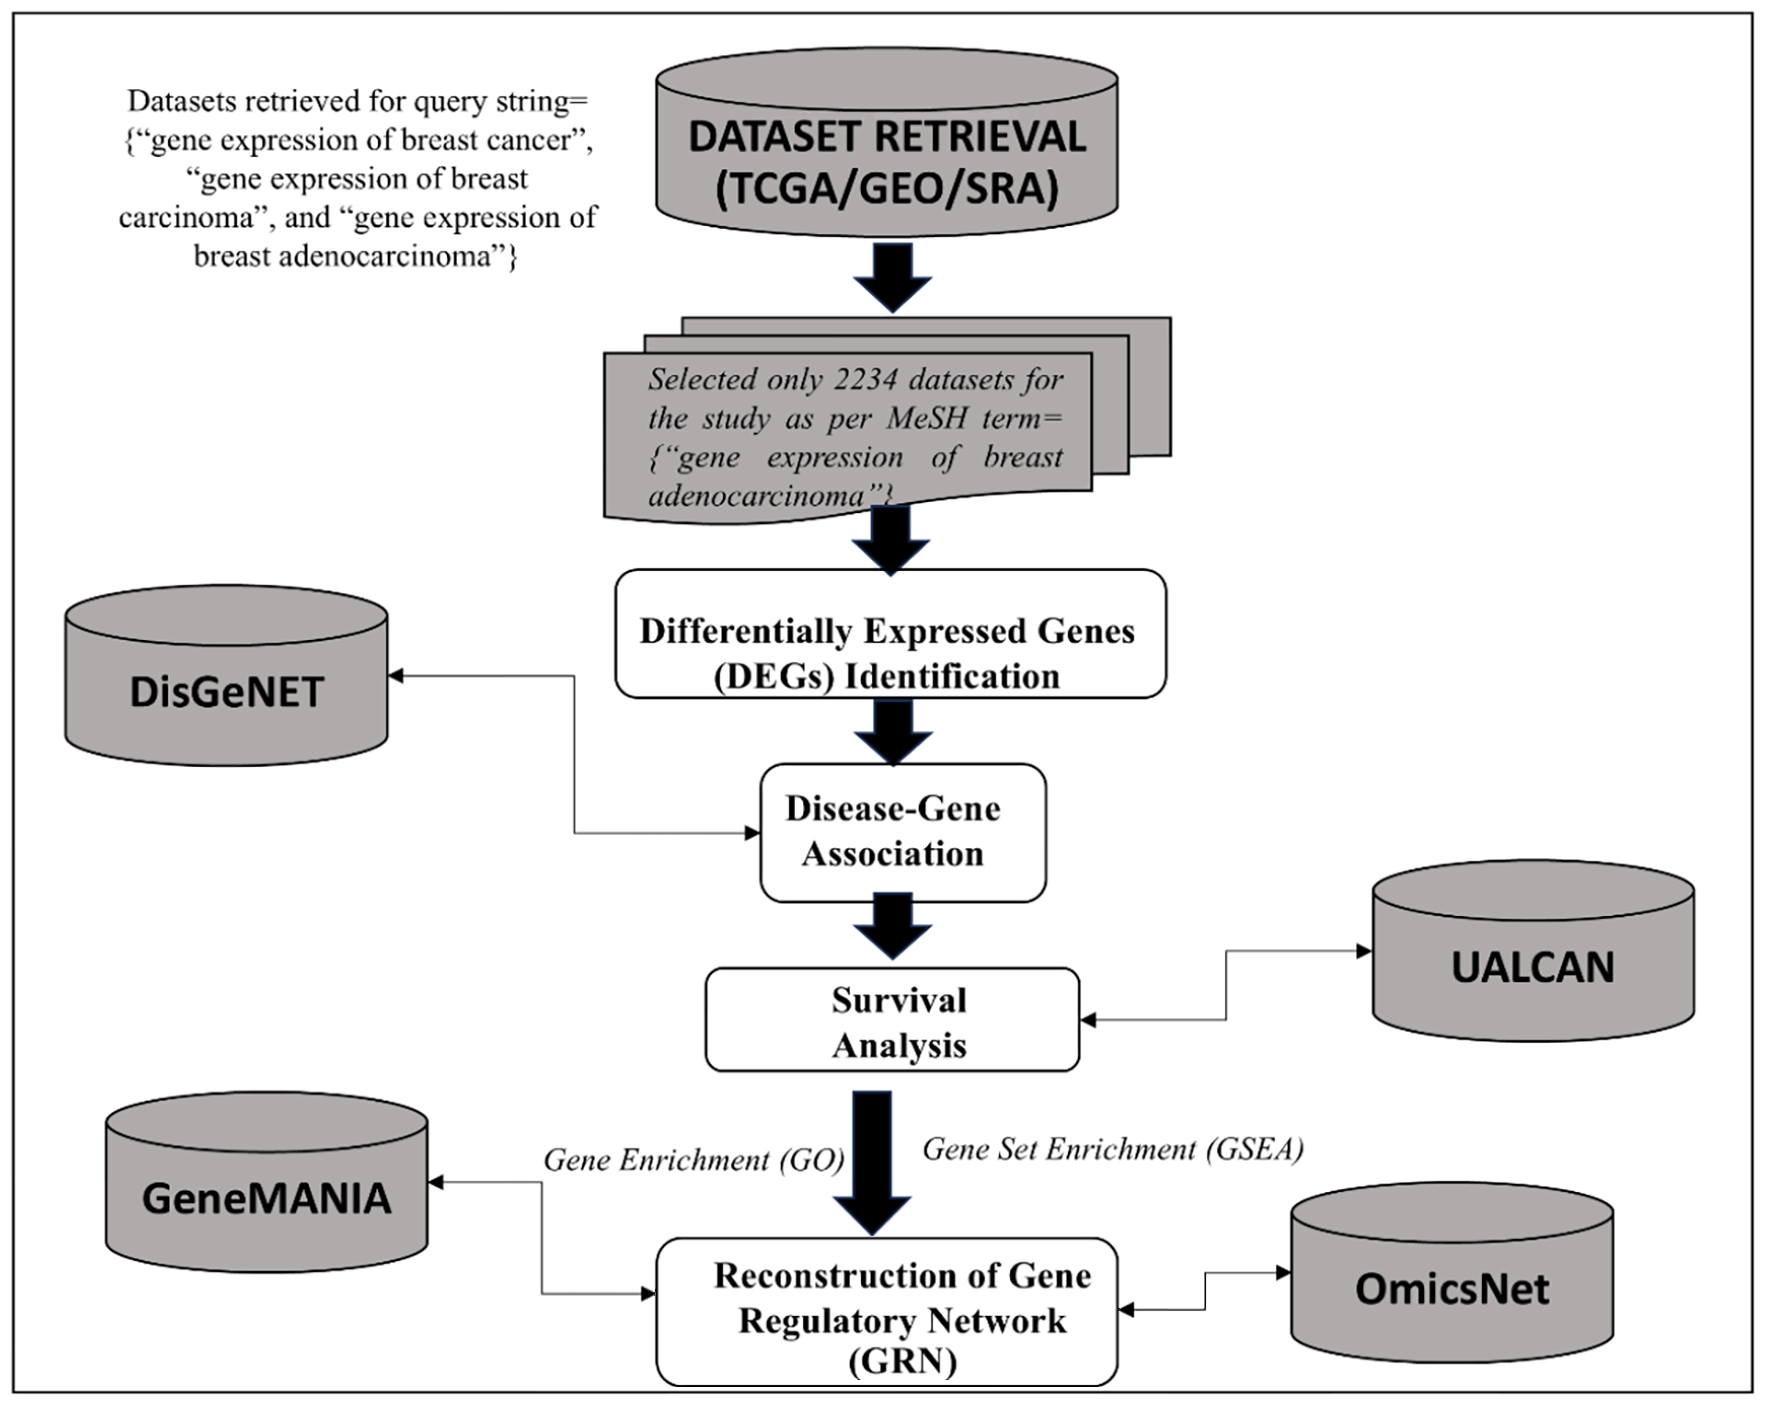
- Workflow of the executed study. TCGA: The cancer genome atlas; GEO: Gene expression omnibus; SRA: Sequence read archival.
Comprehensive Data Integration: UALCAN provides access to multiple datasets from The Cancer Genome Atlas (TCGA) and other databases, enabling comprehensive analysis of gene expression and clinical outcomes. This integrated approach allows for the identification of important correlations and patterns in cancer biology that might be overlooked when using isolated datasets.
Robustness of Kaplan-Meier Analysis: KMplotter is specifically designed for survival analysis in cancer research. It incorporates data from several cancer studies, allowing for a broader examination of survival outcomes. The ability to easily stratify patients based on gene expression levels and visualize survival curves makes KMplotter a preferred choice for analyzing prognostic factors.
Time Efficiency: Utilizing these online tools allows for rapid analysis without the need for extensive computational resources or lengthy setup times. This efficiency is crucial for research timelines and allows us to focus on interpreting the results rather than on the technical aspects of data analysis.
Gene Set Enrichment Analysis (GSEA)
Gene set enrichment analysis, which includes gene ontology analysis, pathway enrichment, and disease-drug associations, helps to determine the biological functions of a group of genes by examining their involvement in specific biological processes, molecular functions, and cellular locations.[22,23] GO enrichment analysis evaluates whether genes are overrepresented or underrepresented according to various annotations based on their genetic expression. For this study, we performed GO enrichment analysis and enriched to explore these associations further.
Construction of Gene Regulatory Network and Analysis
We employed the GeneMania plugin in Cytoscape to construct a gene regulatory network (GRN) using our seed genes.[24,25] GRNs are essential for evaluating the significance of each seed gene in biological processes.[26] GeneMania and Cytoscape were chosen for their strong capabilities in network visualization, topological analysis, and integration of multiple datasets, making them perfect for constructing and analyzing gene regulatory networks. GeneMania also offers advanced features such as predicting gene function, identifying co-expression relationships, and incorporating data from diverse sources, enhancing the biological relevance of network analyses. This is supplemented by Cytoscape, which provides a user-friendly interface for visualization of complex networks and the execution of modularity and centrality analysis to highlight key hub genes. The tools are well-documented and commonly used in bioinformatics, hence the reliability and reproducibility of the results. Topological analysis and network module identification can help identify potential drug targets. We visualized and analyzed the interaction network using the OmicsNet web tool.[27] To predict significant pathways and processes, we conducted Consensus Pathway Analysis using KEGG and GO databases.[28-31]
RESULTS
Data Retrieval from Gene Expression Omnibus
For the query search string, we employed these GEO datasets whose accession IDs are as follows—GSE246599, GSE243375, GSE214052, GSE268662, GSE247750, GSE266354, GSE235350, respectively. Sample Size: The article mentions “transcriptomic profiling of 287 biopsies from 129 patients,” indicating a very good sample size. This is very important for good statistical analysis and making meaningful conclusions. Larger datasets tend to have more power to detect subtle differences and identify rare events.
Tissue Specificity: The study is focused on “breast tumor biopsies,” and thus the data obtained is directly relevant to the research question. This specificity is necessary to understand the unique molecular characteristics of breast cancer and avoid confounding factors from other tissue types.
Data quality: The text points to “RNA-seq profiling,” a high-throughput sequencing technology with high-quality data. This RNA-seq is highly informative in regards to transcriptome coverage, enabling the identification of known and novel transcripts, including splice variants and non-coding RNAs, which will be useful for understanding the complex molecular mechanisms involved in breast cancer.
Clinical Implication: The data was collected in a “phase II neoadjuvant clinical trial,” indicating the clinico-controlled environment of data collection. Such a context would help the integration of characteristics about the patient with respect to treatment efficacy and clinical outcome with molecular data for further comprehensive understanding of the disease. The samples in these GEO datasets were pre-processed as transcriptomic profiling of biopsied breast tumor samples.
Significant DEGs
We employed the FC approach to pinpoint DEGs and identified around 2880 genes displaying significant expression variations. These genes exhibited log2FC scores within the range of -2.0 to +2.0 and had a p-value threshold of ≤0.05. A majority of these genes were upregulated (shown in red), signifying their elevated expression in breast cancer in comparison to downregulated genes (shown in blue) [Figure 2]. Among this group, 144 genes demonstrated particularly noteworthy differential expression, characterized by substantial log2FC values and more stringent p-values, selected for further analysis. Figure 2 illustrates the scatter plot depicting the log2FC values of all genes. Genes whose log2FC > 0: Positive values of log2FC by genes correspond to higher expression in cancerous tissues than in normal samples. These genes often participate in cell proliferation and survival processes as well as oncogenesis. For instance, pathways like growth factor signaling and cell cycle regulation are some among the better-studied ones that are related with upregulated genes. Understanding such pathways is necessary to obtain insights into tumor biology, as well as identify potential therapeutic targets that may be exploited for effective treatment. On the other hand, genes with negative log2FC scores correspond to reduced expression levels. These are commonly tumor-suppressive genes or genes that promote apoptosis. Suppression of these genes facilitates tumorigenesis through uncontrolled cellular proliferation and evasion of programmed cell death, which are two hallmarks of cancer. Identification of these suppressed genes could provide insights into trying to reactivate their function, thus advancing therapeutic outcomes.
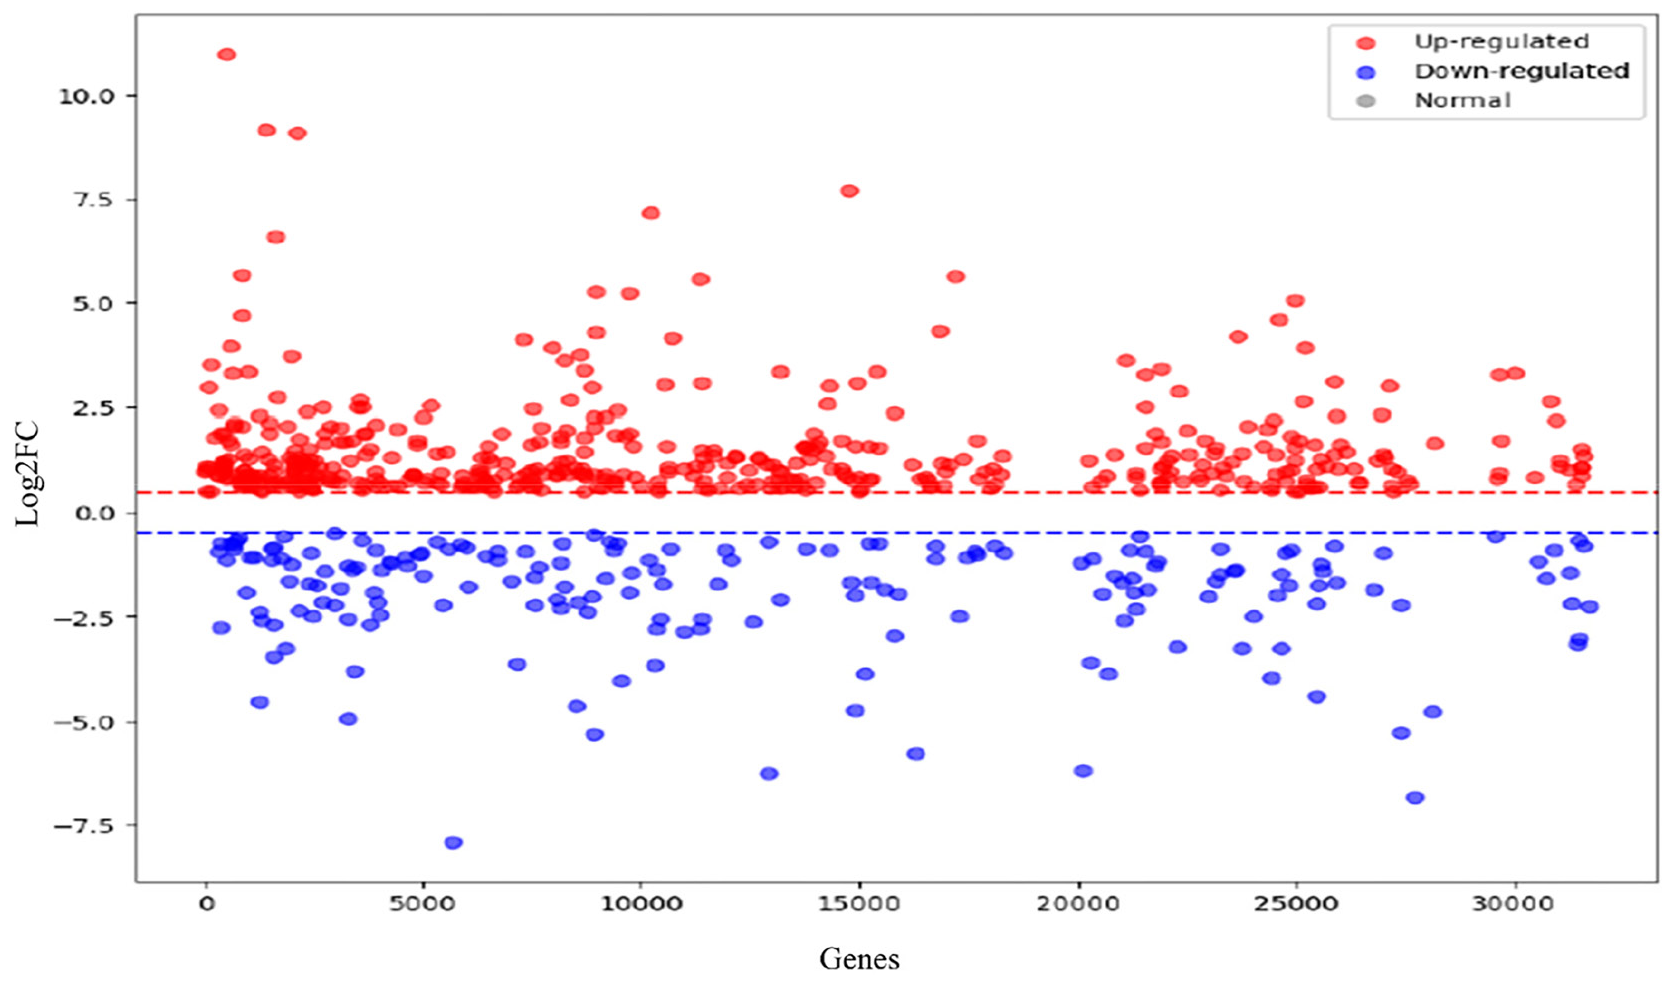
- Scatter plot describing the log2FC values of 2880 DEGs identified in breast carcinoma. Genes with log2FC > 0 are depicted in red, representing upregulated genes, meaning they have increased transcription levels in cancerous compared to normal samples. These genes are typically associated with oncogenic pathways, for instance, cell proliferation, growth factor signaling, and cell cycle regulation that support the disease state of tumor progress. Conversely, downregulated genes typically contain tumor-suppressive genes or those related to apoptosis that facilitate tumorigenesis. Genes have log2FC < 0, as illustrated in blue. The scatter plot emphasizes 144 genes with highly significant log2FC with p = 0.05. These genes have been further analyzed as therapeutic targets or biomarkers for breast cancer progression. DEG: Differentially expressed genes.
Disease-Gene Associations (DGA) Study
By examining the relationship between diseases and genes, we were able to pinpoint potential genetic markers that could predict the course of a specific illness. To narrow down our search, we analyzed 144 genes with altered expression levels in breast carcinoma using the DisGeNET database. We focused on genes that were directly or indirectly linked to the disease and had a causal or contributing role. This process yielded a list of 144 significant genes. These 144 genes, identified through their statistical scores like the disease specificity index (DSI), could potentially play a role in breast cancer development. pleiotropy index (DPI), After analyzing disease-gene associations, we identified 144 genes linked to breast carcinoma. These genes were categorized based on their genetic variations, causal or contributing roles, and altered expression. By focusing on genes with both genetic variations and altered expression, we narrowed down our list to 83.
The key genes were identified through a multi-step process integrating differential expression analysis and DGA scores derived from DisGeNET. Genes were prioritized based on significant fold-change (log2FC > ±0.5849, p < 0.05), known association with breast cancer pathways, and functional annotations from curated databases (e.g., KEGG and GO). Furthermore, Kaplan-Meier survival analysis underlined their prognostic value, thus making them suitable as pivotal targets for studying breast cancer progression. From these 83 genes, we selected 16 common seed genes for further study. Table 1 lists these seed genes and their associated breast carcinoma information.
| S. No | Seed genes | Association | Score GDA |
| 1 | RELB | Altered expression | 0.75 |
| 2 | PRDX5 | Altered expression | 0.7 |
| 3 | RPS9 | Genetic variation | 0.6 |
| 4 | ATP6V0B | Genetic variation | 0.5 |
| 5 | CDKN1A | Causal or contributing | 0.5 |
| 6 | ATP6V0B | Genetic variation | 0.5 |
| 7 | CST4 | Genetic variation | 0.4 |
| 8 | NEURL1 | Genetic variation | 0.45 |
| 9 | STXBP4 | Genetic variation | 0.4 |
| 10 | PXDC1 | Genetic variation | 0.4 |
| 11 | MT-RNR1 | Genetic variation | 0.4 |
| 12 | UPP1 | Causal or contributing | 0.4 |
| 13 | TIMP1 | Altered expression | 0.35 |
| 14 | HMOX1 | Altered expression | 0.35 |
| 15 | EGR1 | Causal or contributing | 0.35 |
| 16 | PIN1 | Causal or contributing | 0.35 |
GDA: Gene disease association.
Expression Analysis Using UALCAN and KM Survival Estimation
From the 83 identified DEGs, we selected 16 genes of interest for further investigation. These 16 seed genes were subjected to KM survival estimations. Genes, namely—RELB, PRDX5, RPS9, ATP6V0B, CDKN1A, CST4, NEURL1, STXBP4, and UPP1, exhibited a higher level of expression than the others. Figure 3 below displays the heatmap of the seed genes. These genes are likely associated with aggressive breast cancers that result in severe outcomes. Kaplan-Meier curves, which illustrate survival probabilities over time, indicate the median survival for patients carrying these genes are represented in Table 2. KM analysis reveals that the seed genes RELB, PRDX5, RPS9, ATP6V0B, CDKN1A, CST4, NEURL1, STXBP4, and UPP1, among others, were associated with a longer median survival time than all other seed genes within the two cohorts used, where low and high expression levels for the gene were used. This would thus mean that such genes may be of immense promise as reliable prognostic markers in the progression of breast cancer. Figure 4 illustrates the KM survival curves for these top-performing genes. The selection of seed genes for further analysis [Table 3] was based on their p-values, hazard ratios, KM survival curves, and expression levels. Kaplan-Meier survival analysis to determine how the expression levels of these identified genes correlate with the outcomes of survival in patients. Additionally, we compared the survival rates among those patients who are stratified into categories of high versus low expression levels of those genes. This is indispensable for determining the significance of the KM curves and hence enables us to properly probe into their prognostic value.
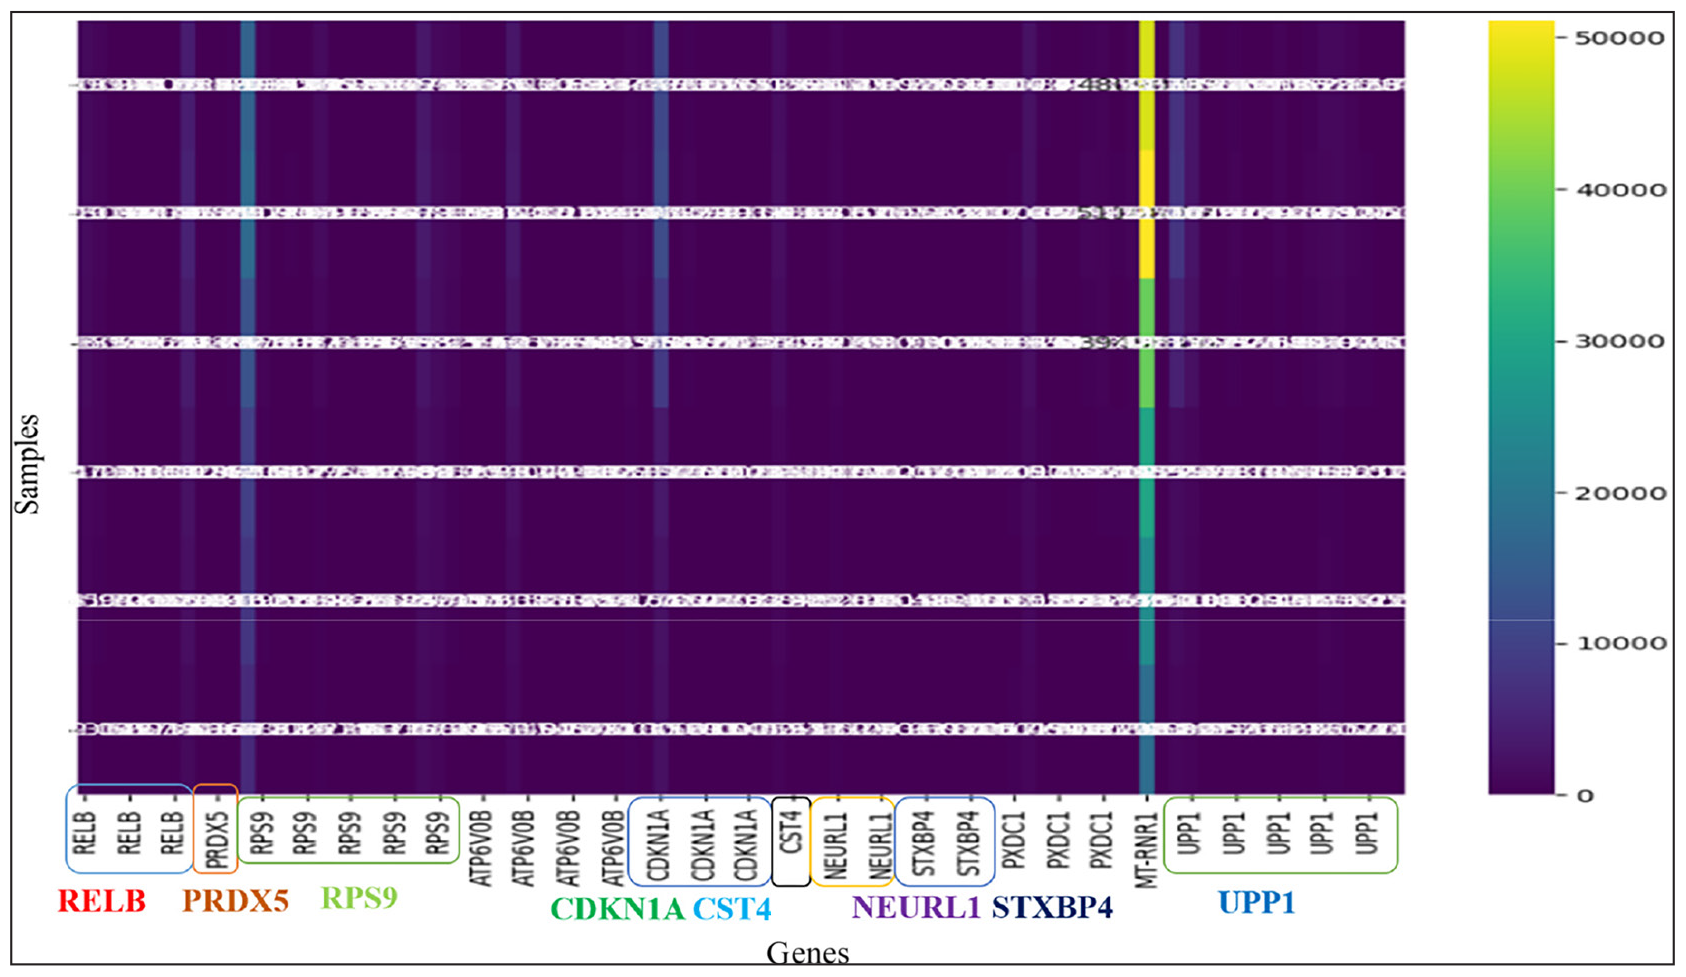
- Heatmap of the expression profiles of seed genes RELB, PRDX5, CDKN1A, CST4, NEURL1, RPS9, STXBP4, and UPP1 in breast carcinoma samples. The heatmap depicts the differential expression of these genes, where higher expression is shown in warmer colors and lower expression in cooler colors. Annotations have been provided to highlight the most significant genes, which were selected based on their prognostic value and statistical significance. These genes are critical in tumor progression, metastasis, and treatment response, which makes them good candidates for breast cancer prognosis and therapeutic targeting. The clustered organization offers insight into co-expression patterns and potential functional interactions among these genes.
| S. No | Seed gene | Description | Low expression cohort (months) | High expression cohort (months) |
| 1 | RELB | RELB Proto-Oncogene, NF-KB Subunit | 228.85 | 216.66 |
| 2 | PRDX5 | Peroxiredoxin 5 | 44 | 33 |
| 3 | RPS9 | Ribosomal Protein S9 | 45.93 | 54 |
| 4 | ATP6V0B | ATPase H+ Transporting V0 Subunit B | 55.2 | 46 |
| 5 | CDKN1A | Cyclin Dependent Kinase Inhibitor 1A | 44.4 | 55 |
| 6 | CST4 | Cystatin S | 191.21 | 216.66 |
| 7 | NEURL1 | Neuralized E3 Ubiquitin Protein Ligase 1 | 40.71 | 62.7 |
| 8 | STXBP4 | Syntaxin Binding Protein 4 | 29 | 54.96 |
| 9 | UPP1 | Uridine Phosphorylase 1 | 69.6 | 37 |
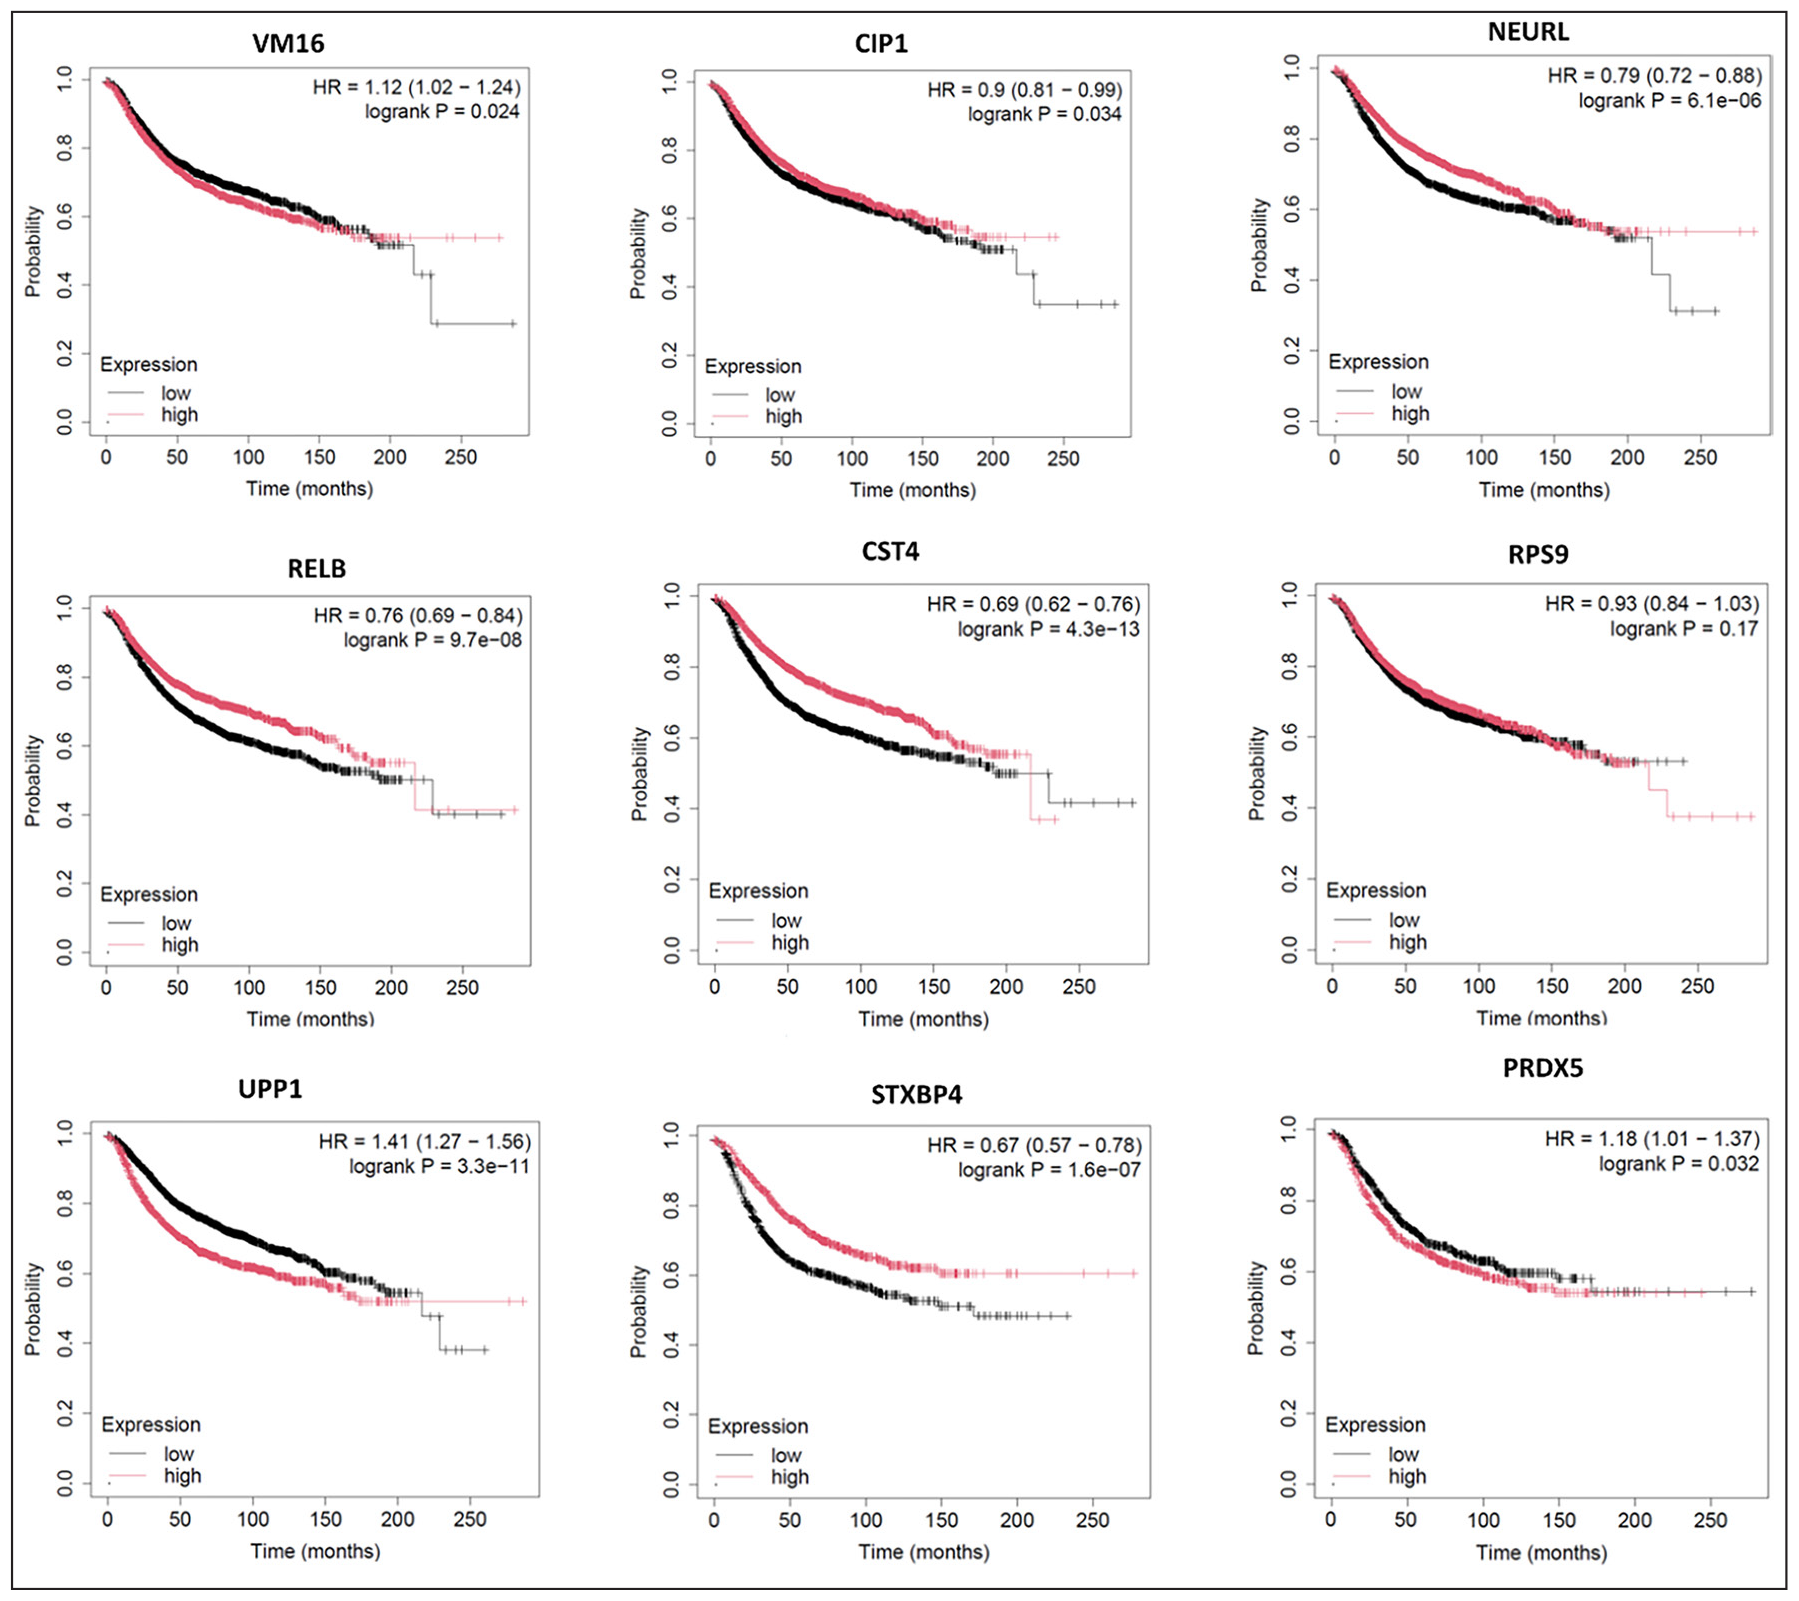
- KM survival curves showing the association between gene expression levels and patient survival profiles in breast cancer. The curves depict survival probabilities as a function of time, where the x-axis represents survival time in months and the y-axis is the survival probability between 0 and 1. Each curve is related to patients divided into two cohorts according to the expression levels of key genes: RELB, PRDX5, RPS9, ATP6V0B, CDKN1A, CST4, NEURL1, STXBP4, and UPP1. It can be demonstrated to affect survival because high expression of some genes, such as CDKN1A and CST4, correlates well with a median survival time of longer months compared to others, such as PRDX5 and UPP1, associated with poorer outcomes. The significance of the finding has been confirmed with appropriate statistical analysis and such an analysis underscores the possibility that these genes have the potential as prognostic markers in breast cancer progression, which are therefore relevant for targeted therapies.
| S. No. | Gene | Hazard ratio (HR) value | 95% CI (lower, upper) | p-value |
| 1 | RELB | 0.76 | 0.68, 0.84 | 9.70E-08 |
| 2 | PRDX5 | 1.18 | 1.01, 1.35 | 0.0321 |
| 3 | RPS9 | 0.93 | 0.80, 1.06 | 0.1682 |
| 4 | ATP6V0B | 1.12 | 1.02, 1.22 | 0.0239 |
| 5 | CDKN1A | 0.9 | 0.82, 0.98 | 0.0345 |
| 6 | CST4 | 0.69 | 0.62, 0.76 | 4.30E-13 |
| 7 | NEURL1 | 0.79 | 0.73, 0.85 | 6.10E-06 |
| 8 | STXBP4 | 0.67 | 0.59, 0.75 | 1.60E-07 |
| 9 | UPP1 | 1.41 | 1.31, 1.51 | 3.30E-11 |
CI: Confidence interval, KM: Kaplan meier.
GSEA of the Key Genes
GSEA indicated that pathways related to cell cycle regulation, DNA repair, and apoptosis were significantly enriched among the DEGs, providing insights into the molecular mechanisms of breast cancer. A gene ontology (GO) enrichment analysis of the eight seed genes reveals their broad involvement in biological processes, molecular functions, and cellular localization.[32] Table 4 provides a detailed breakdown of these enrichment results, showcasing their roles in various processes, their molecular functions, and their localization within major membrane systems. Our analysis emphasizes their predominant localization in membrane structures, including the plasma membrane, endomembrane system, and organelle lumen. Additionally, these seed genes are primarily involved in binding and regulatory activities across different biological processes. Moreover, these genes play pivotal roles in various biological pathways, particularly in gynecological cancers and signaling pathways.
| Gene ontology | ||||
| Seed gene | Biological processes | Molecular function | Cellular localization | Pathway collection |
| RELB | Response to stress, cell cycle process, regulation of response to stimulus, regulation of signaling, response to abiotic stimulus, regulation of molecular function, cell population proliferation, macromolecule localization, regulation of developmental process, regulation of biological quality, cellular component biogenesis, cellular localization. | Transferase activity, small molecule binding, carbohydrate derivative binding, hydrolase activity, protein-containing complex binding, DNA-binding transcription factor activity, molecular function regulator, enzyme regulator activity, molecular adaptor activity. | Chromatin, organelle membrane, ribonucleoprotein complex, extracellular region, cell junction, extracellular space, envelope, protein-DNA complex, cell projection, synapse, supramolecular fiber, endoplasmic reticulum membrane, nuclear outer membrane-endoplasmic reticulum membrane network, extracellular organelle, polymeric cytoskeletal fiber. | Phospholipase D signaling pathway, Th1 and Th2 cell differentiation, AGE-RAGE signaling pathway in diabetic complications, neuroactive ligand-receptor interaction, PD-L1 expression and PD-1 checkpoint pathway in cancer, autoimmune thyroid disease, relaxin signaling pathway, endocrine and other factor-regulated calcium reabsorption, human papillomavirus infection, human T-cell leukemia virus 1 infection, Th17 cell differentiation, asthma, renal cell carcinoma, herpes simplex virus 1 infection, cGMP-PKG signaling pathway, glioma, human immunodeficiency virus 1 infection. |
| PRDX5 | ||||
| RPS9 | ||||
| ATP6V0B | ||||
| CDKN1A | ||||
| CST4 | ||||
| NEURL1 | ||||
| STXBP4 | ||||
| UPP1 | ||||
Gene Regulatory Network Construction, Visualization, and Topological Analysis
GeneMania[33] plugin was used to construct a gene regulatory network (GRN) with the nine seed genes, namely—RELB, PRDX5, RPS9, ATP6V0B, CDKN1A, CST4, NEURL1, STXBP4, and UPP1. Using Cytoscape, we identified 20 genes that directly interact with nine seed genes [Figure 5]. Of these interactions, 82.59% were co-expression associations and 12.62% were physical interactions [Figure 6] [Tables 5 and 6]. We then analyzed these subnetworks using the OmicsNet webserver to identify potential genes, proteins, and microRNAs. Finally, we used the label propagation algorithm (LPA) to visualize the GRN in a more understandable way.[34] After applying LPA, we identified RELB, PRDX5, CDKN1A, CST4, and UPP1 as significant within the resulting subnetwork.[35] These genes showed higher connectivity and greater betweenness centrality [Table 7]. We found that these five genes had connections with different proteins, genes, and microRNAs. To learn more about their functions better, we further analyzed these hub genes using the GeneMania web server. Our research revealed that these genes are implicated in the initiation of various cancers. They activate signaling pathways like cGMP-PKG, longevity regulation, HIV infection, fat metabolism, and drug metabolism. Additionally, these genes are associated with programmed cell death (apoptosis) and negative regulation of the apoptotic process, nucleobase-consisting metabolic process compounds, immune responses, etc. The network associator genes with significant interactions with the seed genes, as mapped by GeneMania, have been displayed in Figure 6.
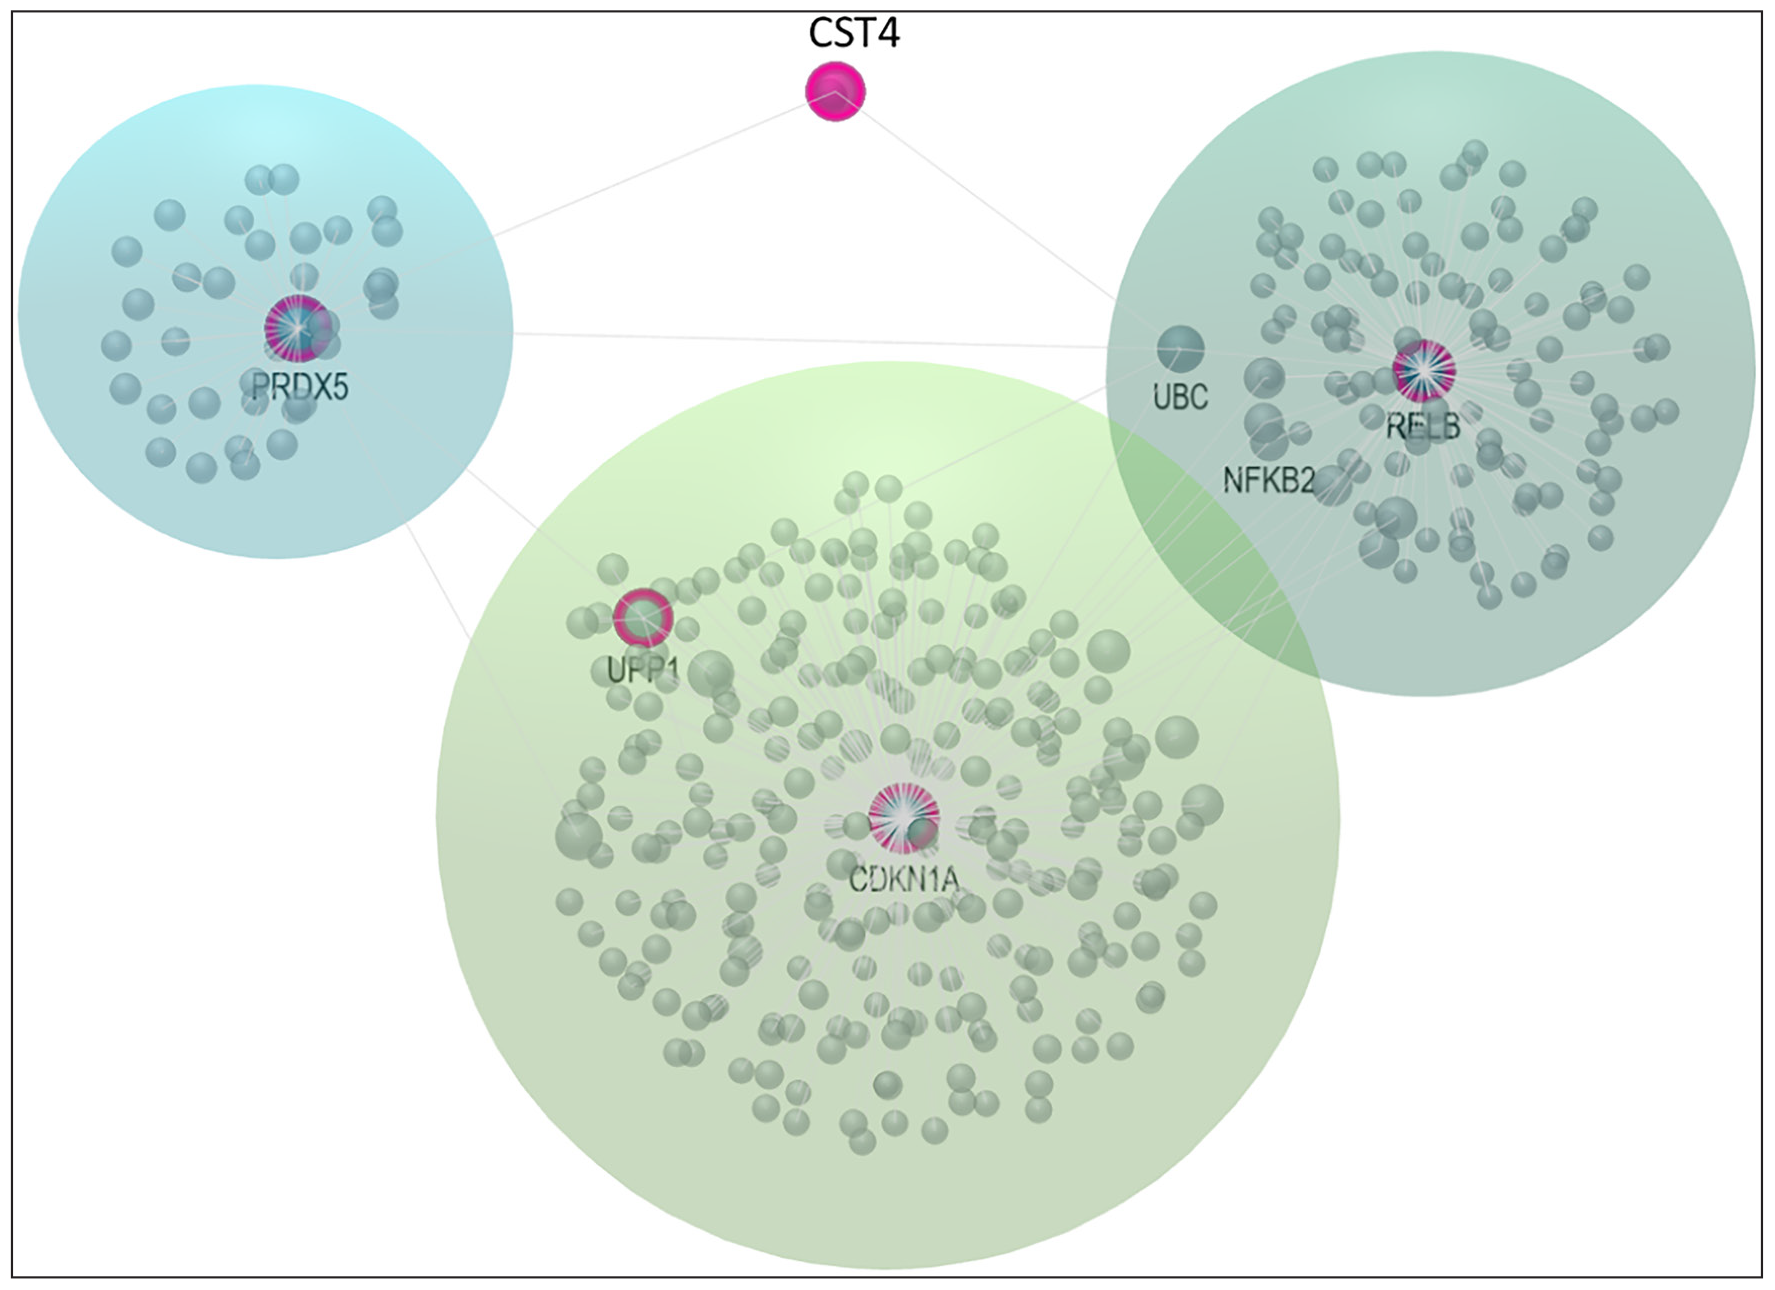
- Reconstruction of the GRN using the LPA using hub genes RELB, PRDX5, CDKN1A, CST4, and UPP1. GRN: Gene regulatory network, LPA: Label propagation algorithm.
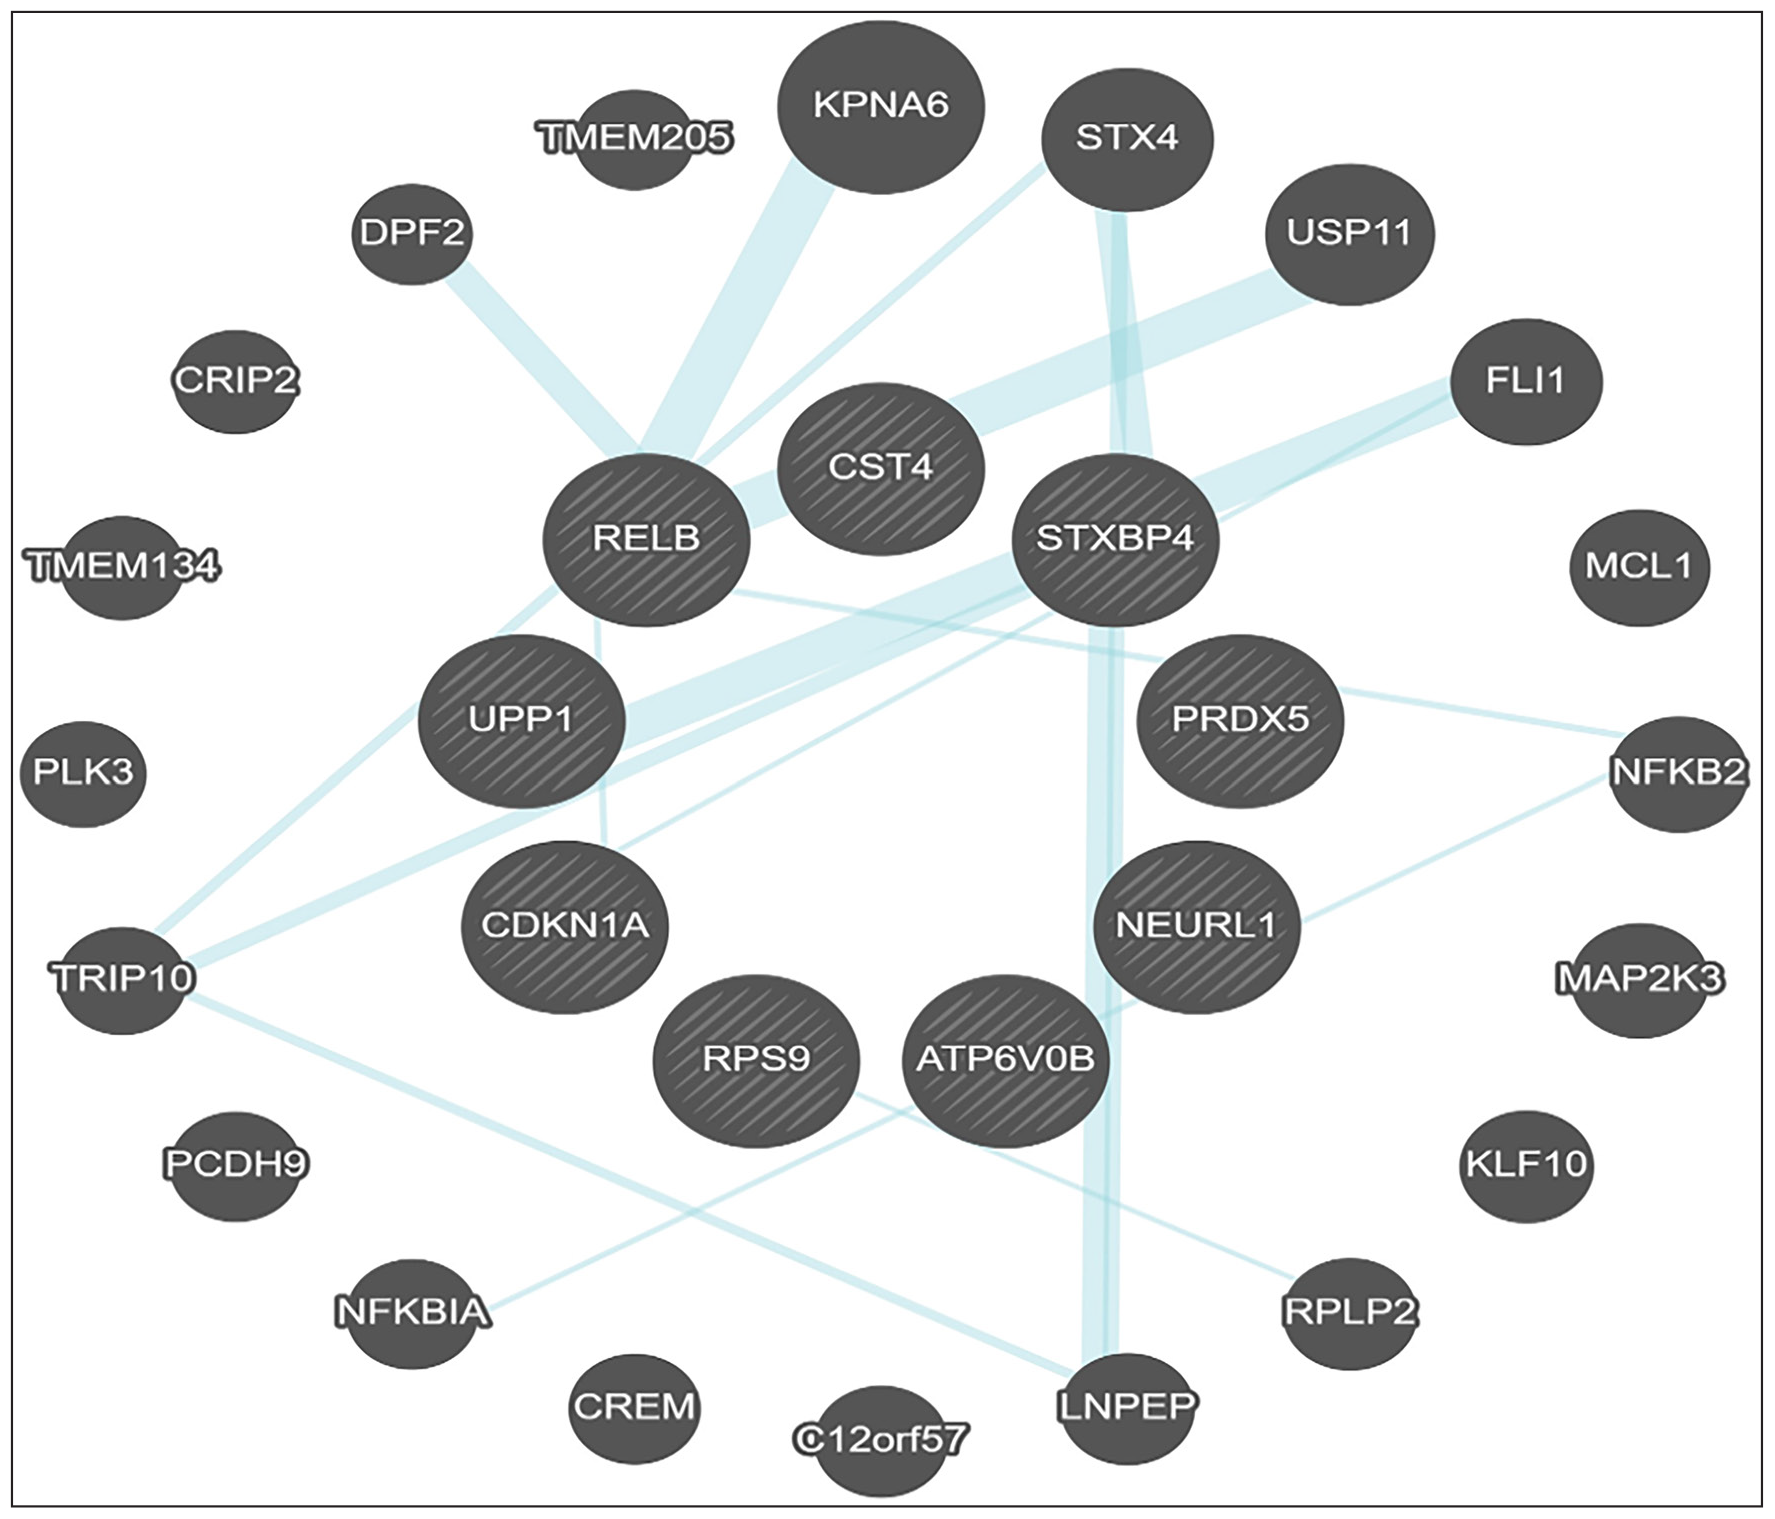
- RELB, PRDX5, CDKN1A, CST4, and UPP1 network association with other genes using GeneMania.
| Gene | GO term | Statistical significance |
| RELB | Regulation of transcription | p < 0.01 |
| PRDX5 | Response to oxidative stress | p < 0.05 |
| RPS9 | Ribosomal protein | p < 0.05 |
| ATP6V0B | Vacuolar ATPase | p < 0.01 |
| CDKN1A | Cell cycle regulation | p < 0.01 |
| CST4 | Cystatin activity | p < 0.05 |
| NEURL1 | Neural development | p < 0.05 |
| STXBP4 | Protein transport | p < 0.05 |
| UPP1 | Nucleotide metabolism | p < 0.05 |
GO: Gene ontology, ATP: Subunit of mitochondrial ATP synthase.
| Gene | Degree | Betweenness centrality | Closeness centrality |
| RELB | 5 | 0.12 | 0.75 |
| PRDX5 | 4 | 0.10 | 0.70 |
| RPS9 | 3 | 0.08 | 0.65 |
| ATP6V0B | 2 | 0.05 | 0.60 |
| CDKN1A | 5 | 0.15 | 0.80 |
| CST4 | 2 | 0.03 | 0.55 |
| NEURL1 | 3 | 0.07 | 0.67 |
| STXBP4 | 4 | 0.09 | 0.68 |
| UPP1 | 3 | 0.06 | 0.66 |
| Gene name | Degree | Involved in pathways | Motifs present in hub genes | p-value |
| RELB | 116 | cGMP-PKG signaling pathway | GGGNNTTTCC_V$NFKB_Q6_01 | 0.204 |
| PRDX5 | 38 | Longevity regulating pathway | V$IRF2_01 | 0.0612 |
| CDKN1A | 251 | Human immunodeficiency virus 1 infection (HIV) | V$AR_01 | 0.225 |
| CST4 | 3 | Fat digestion and absorption | GATTGGY_V$NFY_Q6_01 | 0.0663 |
| UPP1 | 9 | Drug metabolism - other enzymes | TATAAA_V$TATA_01 | 0.0584 |
DISCUSSION
Our analysis of 16 common seed genes revealed that most exhibit low RNA quality. However, nine genes—RELB, PRDX5, RPS9, ATP6V0B, CDKN1A, CST4, NEURL1, STXBP4, and UPP1—showed significantly higher expression levels. These genes are more likely to be associated with severe breast cancer cases. Moreover, survival analysis indicates that these nine genes are linked to better survival outcomes, regardless of their expression levels. We selected these genes based on their statistical significance, hazard ratios, and survival curves.
These nine genes, RELB, PRDX5, RPS9, ATP6V0B, CDKN1A, CST4, NEURL1, STXBP4, and UPP1, play a pivotal role in driving breast cancer in women. A gene set enrichment analysis revealed that these key genes are predominantly located within the cell membrane. system. These five seed genes play essential roles in regulating various biological processes, as evidenced by their involvement in diverse disease and signaling pathways. Notably, they are implicated in apoptosis, negative regulation of apoptosis, nucleobase-containing compound metabolism, and immune responses.
The dual criterion provides a basis for filtering those genes that are likely to become important contributors to the progression of the disease.
Gene Prioritization: We enrich genes that have strong differential expression, based on our set fold-change and statistical significance thresholds. We also include genes participating in known genetic changes, like SNPs or CNVs, as annotated in databases, such as DisGeNET and COSMIC. This approach gives us the opportunity to consider genes that both have an abnormality in their expression profile and do have some background genetic changes.
Impact of Genetic Variants: These may cause changes in gene functions to either be a loss-of-function or gain-of-function that may contribute to tumorigenesis. We focused on genes herein described with both significant expression alterations and genetic mutations, hoping to identify those in which function impact is higher on the disease process. For instance, oncogenes can have mutations that increase the activity of protein while the mutation in tumor suppressor genes would result in reduced protective functions against uncontrolled cell growth. The combination of significant expression data with information on genetic variation makes our appreciation of the roles such genes play in the progression of breast cancer stronger. Genes upregulated due to mutations within regulatory regions or downregulated as a result of disruptive mutations are more likely to arise in the malignant phenotype of breast carcinoma. Their identification can provide an insight into how a mechanism of breast cancer works, opening doors to an in-depth understanding of the dynamics of the tumor and to favorable therapeutic targets [Table 8].[36]
| Gene | Functional role | Biological implications in breast cancer | Hazard ratio | p-value | Confidence interval (95%) |
| RELB | Regulation of NF-?B signaling pathway, transcriptional activation | Promotes cell survival, inflammation, and chemoresistance; associated with metastasis | 0.76 | 9.70E-08 | 0.62–0.92 |
| PRDX5 | Antioxidant enzyme; regulation of oxidative stress | Reduces reactive oxygen species; supports tumor progression and resistance | 1.18 | 0.0321 | 1.02–1.37 |
| CDKN1A | Cell cycle inhibitor; regulation of p21 | Inhibits uncontrolled proliferation; potential marker for high-grade breast cancers | 0.90 | 0.0345 | 0.80–1.02 |
| CST4 | Cysteine protease inhibitor | Promotes immune evasion and tumor growth; linked to metastasis in advanced cancers | 0.69 | 4.30E-13 | 0.54–0.83 |
| UPP1 | Nucleotide metabolism; uridine salvage pathway | Maintains cancer cell survival and stemness; associated with drug resistance | 1.41 | 3.30E-11 | 1.22–1.63 |
Network reconstruction analysis identified a core sub-network composed of RELB, PRDX5, CDKN1A, CST4, and UPP1, which is further connected to smaller proteins and microRNAs. Of interest, RELB and PRDX5 genes were highly implicated in apoptosis and oxidative stress pathways, where BRCA1 and BRCA2 are very strongly implicated in DNA repair. However, our study points to their unique promise as markers of prognosis that may be different from HER2, mainly in basal-like breast cancer subtypes. These genes are known to contribute to cancer development and are associated with signaling pathways such as cGMP-PKG signaling, longevity regulation, HIV infection, fat digestion and absorption, and drug metabolism. Novel therapeutic opportunities also arise from identified genes, like RELB and UPP1. As such, RELB is involved with immune evasion mechanisms, thus opening the way to immune checkpoint therapies, whereas the involvement of UPP1 with cellular stemness makes it a biomarker of early-stage breast cancer.
The seed genes identified include RELB, PRDX5, CDKN1A, CST4, and UPP1, all of which are involved in breast cancer progression through different mechanisms. RELB is a component of the non-canonical NF-?B signaling pathway that is involved in the promotion of cellular proliferation and survival under inflammatory conditions, thus promoting tumor progression and resistance to chemotherapy. PRDX5 is known for its antioxidant properties, which protect cancer cells from oxidative stress, thereby enhancing their survival and metastatic potential.
CDKN1A (p21), a cyclin-dependent kinase inhibitor, is a tumor suppressor that has bimodal functions in breast cancer. Although overexpression leads to cell cycle arrest and induction of apoptosis, this action is often dampened in high-grade tumors. The encoding for cystatin S is found in CST4, and its elevation by association with proteolytic activity in the tumor microenvironment favors metastasis by degrading the extracellular matrix. UPP1 maintains the stemness of cancer cells, including cancer stem cells that play a major role in metastasis and therapy resistance due to its association with nucleotide metabolism. By comparison, some of these genes have been implicated in other cancers. For example, RELB is upregulated in ovarian cancer and has broader implications as a target for therapy. Again, PRDX5 has an antioxidant role that is very critical in the development of colorectal cancer; it thus serves an important function in managing oxidative stress across various cancer types. These findings underscore the therapeutic potential of these genes. RELB and CST4 emerge as promising targets for early detection and metastasis intervention, while UPP1 represents a viable candidate for targeting cancer stem cells. Collectively, these insights pave the way for developing personalized therapeutic strategies aimed at mitigating tumor progression, metastasis, and treatment resistance.
Among these genes, CDKN1A is a recognized genetic marker for breast cancer, regulating the innate immune response by inhibiting NK cell function. RELB and CST4 are overexpressed in breast cancer, while CDKN1A can create an immune-evasive environment. REBL is a potential target for chemotherapy-resistant breast cancer and could serve as an early screening marker. UPP1 is involved in maintaining cellular stemness, including cancer stem cells, making it a promising target for breast cancer screening. CDKN1A is underexpressed in high-grade serous breast cancer, and PRDX5 is a tumor cell-intrinsic molecule that promotes autophagy. Therefore, CDKN1A could potentially be an indicator of autophagy in breast cancer.
CONCLUSION
Our findings indicate that the genes RELB, PRDX5, CDKN1A, CST4, and UPP1 play a crucial role in the development of breast cancer in women. These genes could serve as valuable biomarkers for initial screening of breast cancer patients. This research has successfully identified and characterized key genes involved in breast cancer, offering valuable insights into its molecular mechanisms. Further studies should focus on validating these findings through in vitro and in vivo experiments. Additionally, investigating the potential of these genes for breast cancer diagnosis, prognosis, and treatment is recommended.
Acknowledgments
The authors are thankful to the Ministry of Electronics and Information Technology (MeitY) (file no. 1(1)/2019-ME&HI) and the Department of Biotechnology (DBT), Govt. of India.
Ethical approval
Ethical clearance was not in place since the study is purely based on publicly available databases and does not pertain to human subjects, direct patient information, or clinical procedures. Therefore, no ethical clearance was necessary.
Declaration of patient consent
Patient’s consent not required as there are no patients in this study.
Financial support and sponsorship
Nil.
Conflicts of interest
There are no conflicts of interest.
Use of artificial intelligence (AI)-assisted technology for manuscript preparation
The authors confirm that there was no use of artificial intelligence (AI)-assisted technology for assisting in the writing or editing of the manuscript and no images were manipulated using AI.
REFERENCES
- Global cancer statistics 2024: GLOBOCAN estimates of incidence and mortality worldwide for 36 cancers in 185 countries. CA Cancer J Clin. 2024;71:209-49.
- [Google Scholar]
- The cancer genome atlas pan-cancer analysis project. Nat Gen. 2013;45:1113-20.
- [CrossRef] [PubMed] [PubMed Central] [Google Scholar]
- Identification of ApoA1, HPX and POTEE genes by omics analysis in breast cancer. Oncol Rep. 2024;32:1078-86.
- [CrossRef] [PubMed] [Google Scholar]
- Serum levels of the cancer-testis antigen POTEE and its clinical significance in non-small-cell lung cancer. PLOS One. 2015;10:e0122792.
- [CrossRef] [PubMed] [PubMed Central] [Google Scholar]
- MUC16 as a novel target for cancer therapy. Expert Opin Ther Targets. 2018;22:675-86.
- [CrossRef] [PubMed] [PubMed Central] [Google Scholar]
- Principal component analysis: A review and recent developments. Phil Trans R Soc A Math Phys Eng Sci. 2016:374. [Accessed 2024 Jul 25]
- [CrossRef] [PubMed] [PubMed Central] [Google Scholar]
- Understanding survival analysis: Kaplan-Meier estimate. Int J Ayurv Res. 2010;1:274.
- [CrossRef] [PubMed] [PubMed Central] [Google Scholar]
- Stable gene expression for normalization and single-sample scoring. Nucl Acids Res. 2020;48:e113.
- [CrossRef] [PubMed] [PubMed Central] [Google Scholar]
- Interpretation of biological experiments changes with evolution of the gene ontology and its annotations. Sci Rep 2018:8.
- [CrossRef] [PubMed] [PubMed Central] [Google Scholar]
- Controlling the false discovery rate: A practical and powerful approach to multiple testing. J R Stat Soc Ser B. 2022;57:289-300.
- [Google Scholar]
- DisGeNET: A comprehensive platform integrating information on human disease-associated genes and variants. Nucl Acids Res. 2024;45:D833-9.
- [CrossRef] [PubMed] [PubMed Central] [Google Scholar]
- UALCAN: An update to the integrated cancer data analysis platform. Neoplasia. 2022;25:18-27.
- [CrossRef] [PubMed] [PubMed Central] [Google Scholar]
- UALCAN: An integrated data-mining platform to facilitate the comprehensive analysis of cancer transcriptome. School of Medicine - Pathology, UAB; 2021
- [Google Scholar]
- The European genome-phenome archive in 2021. Nucl Acids Res. 2021;50:D980-7.
- [CrossRef] [PubMed] [PubMed Central] [Google Scholar]
- Gene ontology: Tool for the unification of biology. Nat Gen. 2000;25:25-9.
- [CrossRef] [PubMed] [PubMed Central] [Google Scholar]
- G: Profiler: A web server for functional enrichment analysis and conversions of gene lists (2019 Update). Nucl Acids Res. 2019;47:W191-8.
- [CrossRef] [PubMed] [PubMed Central] [Google Scholar]
- GeneMania update 2018. Nucl Acids Res. 2018;46:W60-4.
- [CrossRef] [PubMed] [PubMed Central] [Google Scholar]
- Cytoscape: A Software environment for integrated models of biomolecular interaction networks. Genome Res. 2003;13:2498-504.
- [CrossRef] [PubMed] [PubMed Central] [Google Scholar]
- OmicsNet: A web-based tool for creation and visual analysis of biological networks in 3D space. Nucl Acids Res. 2018;46:W514-22.
- [CrossRef] [PubMed] [PubMed Central] [Google Scholar]
- CPA: A web-based platform for consensus pathway analysis and interactive visualization. Nucl Acids Res. 2021;49:W114-24.
- [Google Scholar]
- KEGG: Kyoto encyclopedia of genes and genomes. Nucl Acids Res. 2000;28:27-30.
- [CrossRef] [PubMed] [PubMed Central] [Google Scholar]
- KEGG: New perspectives on genomes, pathways, diseases and drugs. Nucl Acids Res. 2016;45:D353-61.
- [CrossRef] [PubMed] [PubMed Central] [Google Scholar]
- ConsensusPathDB 2022: Molecular interactions update as a resource for network biology. Nucl Acids Res. 2021;50:D587-95.
- [CrossRef] [PubMed] [PubMed Central] [Google Scholar]
- Enrich: Interactive and collaborative HTML5 gene list enrichment analysis tool. BMC Bioinformatics. 2013;14:128.
- [CrossRef] [PubMed] [PubMed Central] [Google Scholar]
- GeneMANIA Cytoscape plugin: Fast gene function predictions on the desktop. Bioinformatics. 2010;26:2927-8.
- [CrossRef] [PubMed] [PubMed Central] [Google Scholar]
- Community detection with the label propagation algorithm: A survey. Phys A.. 2019;534:122058.
- [Google Scholar]
- A modified label propagation algorithm for community detection in attributed networks. Int J Inf Manag Data Insights. 2021;1:100030.
- [CrossRef] [Google Scholar]
- Recent advances in predicting gene–disease associations. F1000Research. 2017;6:578.
- [CrossRef] [PubMed] [PubMed Central] [Google Scholar]